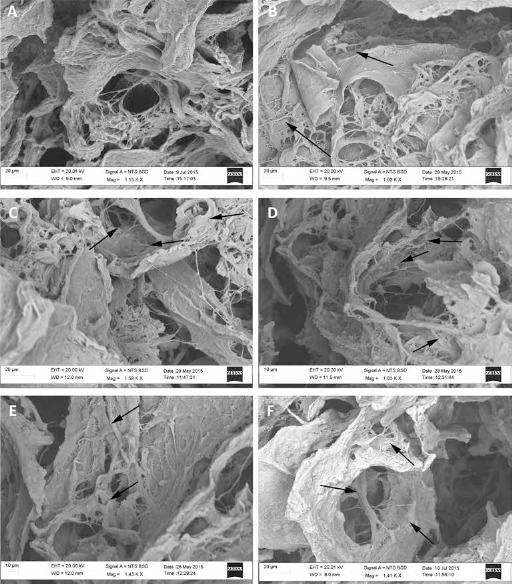
Fig. 2.

Ultrastructural analysis. SEM images of untreated (Untreated Scaffold: A, C and E) and LIPUS treated (LIPUS scaffold: B, D and F) engineered osteogenic scaffold at 7d (A and B), 14d (C and D), and 14 days on +7 days off (E and F) (scale bar: 10 µm). The arrows indicate hMSCs spreading onto the scaffold surface.
