
Table 4.
In-vitro biological evaluation of compounds derived by Scheme 4.
| IC50 (nM)* | Microsome stability (min) | |||||||||
|---|---|---|---|---|---|---|---|---|---|---|
| Compd. | R1 | MMP-13 | MMP-2 | MMP-8 | clogD7.4a | clogPb | rat | mouse | human | Collagen cleavage (20 μM) |
| 2 | 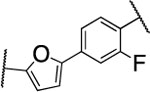 |
2.7±0.6 | >5000 | >5000 | 4.2 | 3.0 | 9 | 20 | 12 | >90% |
| 52 | 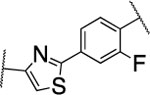 |
7.1±0.8 | >5000 | 1100±236 | 3.6 | 3.3 | 9 | 26 | 12 | >90% |
| 53 | 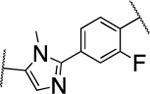 |
>5000 | nd | nd | 3.3 | 2.7 | 14 | 110 | 59 | nd |
| 54 | 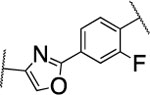 |
18±4.9 | nd | nd | 3.2 | 2.5 | 10 | 31 | 21 | 40% |
| 55 | 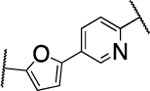 |
38±7.5 | >5000 | >5000 | 3.3 | 1.5 | 4 | 12 | 96 | 65% |
| 56 | 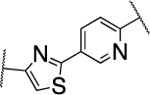 |
148±8.5 | nd | nd | 3.8 | 3.3 | 5 | 20 | 82 | nd |
*
The IC50 values for MMP-1, MMP-9, and MT1-MMP are >5 μM for all compounds. nd = not determined.
a
Calculated with Pipeline Pilot workflow application (Accelrys) at pH 7.4.
b
Calculated with ChemDraw.