Table 6.
In-vitro biological evaluation of compounds derived from Scheme 8.
| IC50(nM)† | Microsome stability (min) | ||||||||
|---|---|---|---|---|---|---|---|---|---|
| Compd. | R1 | MMP-13 | MMP-2 | MMP-8 | logD7.4a | logPb | rat | mouse | human |
| 2 |  |
2.7±0.6 | >5000 | >5000 | 4.2 | 3.0 | 9 | 20 | 12 |
| 99 | 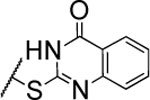 |
9.4±1.7* | >5000 | 400±38.0 | 4.6 | 3.6 | nd | nd | nd |
| 100 |  |
2.5±0.5* | >5000 | 270±38.0 | 4.8 | 3.8 | 4 | 28 | 8 |
| 101 | 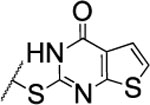 |
8.4±1.4 | nd | nd | 4.4 | 3.4 | 6 | 29 | 14 |
| 102 |  |
13±2.7 | nd | nd | 4.9 | 3.9 | 4 | 28 | 13 |
| 103 | 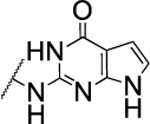 |
>5000 | nd | nd | 3.7 | 2.9 | nd | nd | nd |
| 104 | 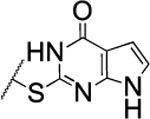 |
2000±850 | nd | nd | 3.7 | 2.9 | nd | nd | nd |
| 105 | 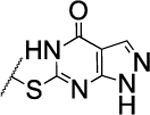 |
274±29.0 | nd | nd | 3.1 | 2.4 | nd | nd | nd |
| 106 | 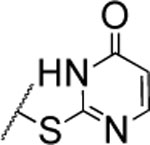 |
153±13.0 | nd | nd | 3.1 | 2.0 | 33 | 57 | 160 |
| 107 | 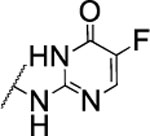 |
2600±480 | nd | nd | 1.7 | 1.9 | nd | nd | nd |
| 108 |  |
1300±110 | nd | nd | 3.5 | 2.5 | nd | nd | nd |
| 109 |  |
88±5.6 | nd | nd | 3.7 | 2.5 | nd | nd | nd |
| 110 |  |
1200±200 | nd | nd | 4.3 | 3.0 | 41 | 43 | >120 |
IC50 values for MMP-1, MMP-9, and MT1-MMP > 5 μM.
Some selectivity profiles among MMP-1, MMP-2, MMP-8, MMP-9 and MT1-MMP were not determined due to either low activity or poor microsomal stability of the compound. nd = not determined.
Calculated with Pipeline Pilot workflow application (Accelrys) at pH 7.4.
Calculated with ChemDraw.
