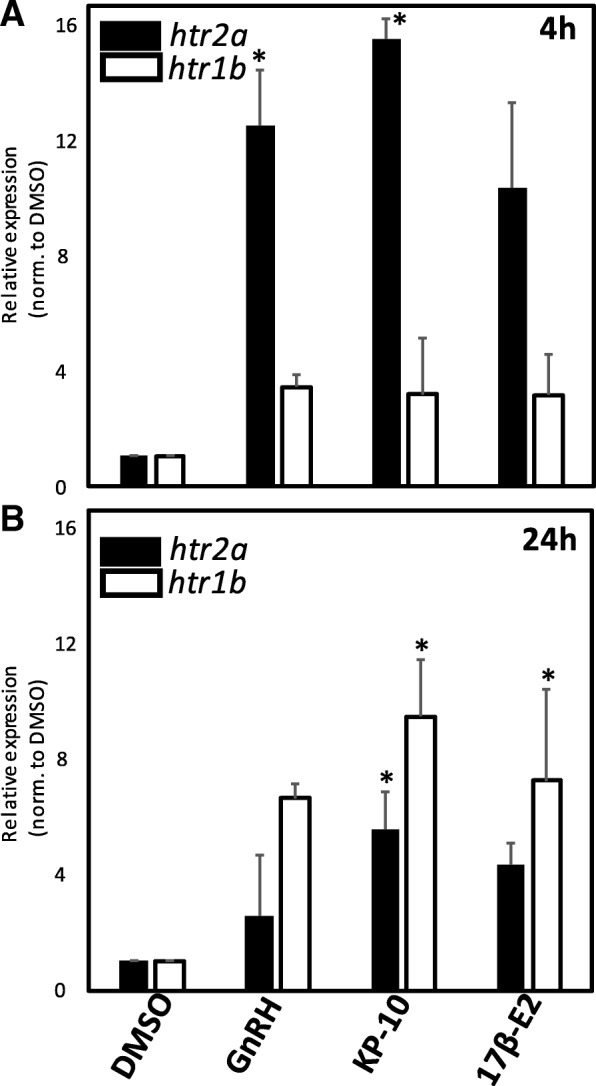
Fig. 5.

a Relative expression of htr2a (black bars) and htr1b (white bars) following 4 h treatment with 1.0 nM GnRH, 10.0 nM kisspeptin-10, or 100.0 pM 17β-E2. b Relative expression of htr2a and htr1b following 24 h (right panel) treatment with 1.0 nM GnRH, 10.0 nM kisspeptin-10, or 100.0 pM 17β-E2. (*, p < 0.05, n = 5 for each treatment group)
