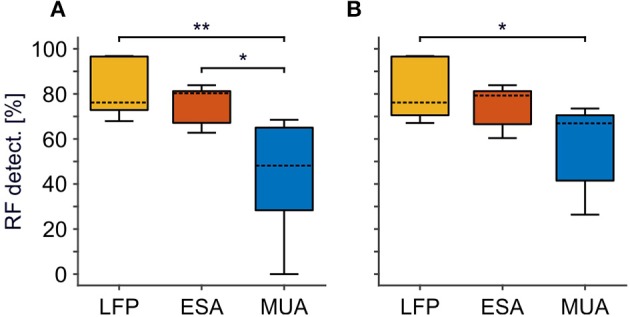
Figure 2.

Comparison of RF detection rate between LFP, ESA, and MUA. (A) Standard approach for thresholding MUA. (B) Optimized, iterative approach for thresholding MUA to maximize MUA-based detection rate. For each signal type, boxplots are based on detection rates of individual animals. Detection rates refer to the absolute number of RFs detected relative to the number of recording sites with a significant visual activation for at least one of the signals, merged over all animals. Boxes indicates the 25th and 75th percentile, dashed lines indicate the medians, and whiskers indicate the full range of data. Asterisks indicate statistical difference for α < 0.5% (*) and α < 0.05% (**), respectively.
