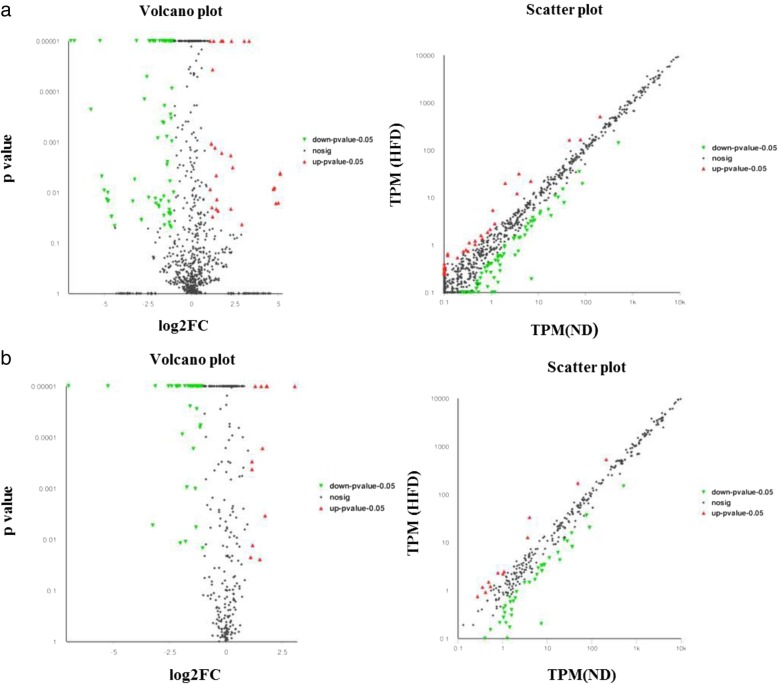
Fig. 4.
The volcano plot and scatter plot of the known (a) and novel (b) differentially expressed miRNAs between the two groups. Red spots represent upregulated miRNAs, and green spots indicate downregulated miRNAs. Back spots represent miRNAs that did not show obvious changes between the ND and HFD groups. ND, normal diet mice; HFD, high-fat diet mice

