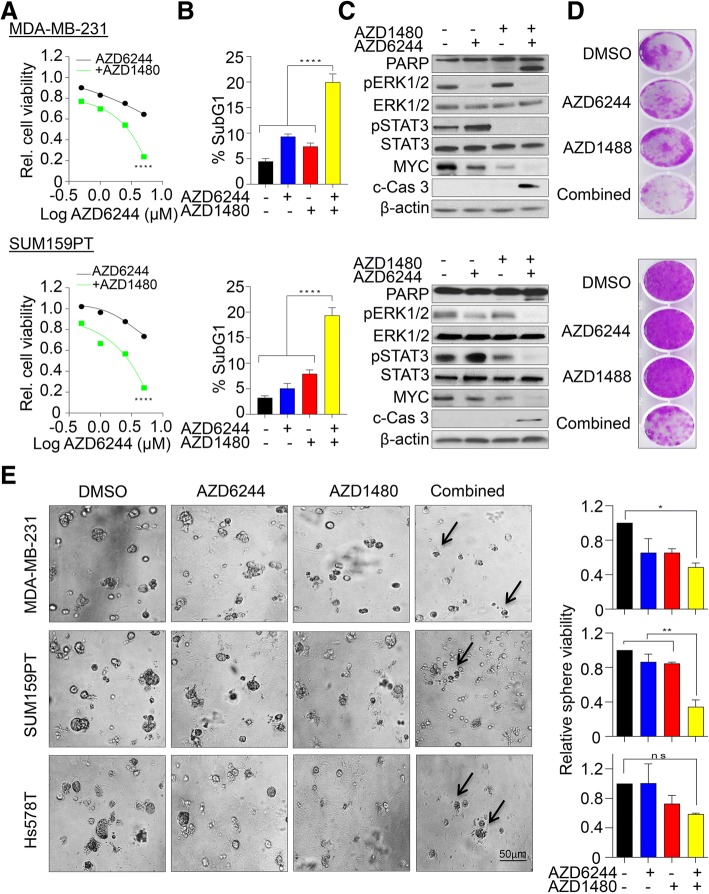
Fig. 1.
MEK1/2 and JAK2 inhibition-mediated resistance in TNBC cells. a MDA-MB-231 (upper panel) and SUM159PT (lower panel) cells were exposed to different concentrations of MEK1/2 inhibitor (AZD6244) alone or in combination with JAK2 inhibitor (AZD1480 2.5 μM) and cell viability was determined after 6 days using MTS assays. The dose-response curve was generated by calculating cell viability relative to untreated control and plotted against drug concentration, n = 3 with SEM (****p < 0.0001). b Percentage of sub-G1 population identified using propidium iodide staining and quantified by FACS following single and combination treatment with AZD6244 (1 μM) and AZD1480 (2.5 μM) inhibitors after 72 h, n = 3 with SEM (****p < 0.0001). c Immunoblot analysis of both SUM159PT and MDA-MB-231 cell lines treated with single and combination treatments after 48 h and levels of indicated proteins were determined. d Representative images of colony forming capacity after single and combination treatment at 14 day determined using crystal violet staining. e Left, representative phase-contrast images of MDA-MB-231, SUM159PT and HS578T cells grown on Matrigel for 14 days. Cells were treated with indicated drugs after 2 days of seeding. Right, Relative sphere viability determined using MTS assay. n = 2 with SEM (*p < 0.05, **p < 0.01, ns: not significant)

