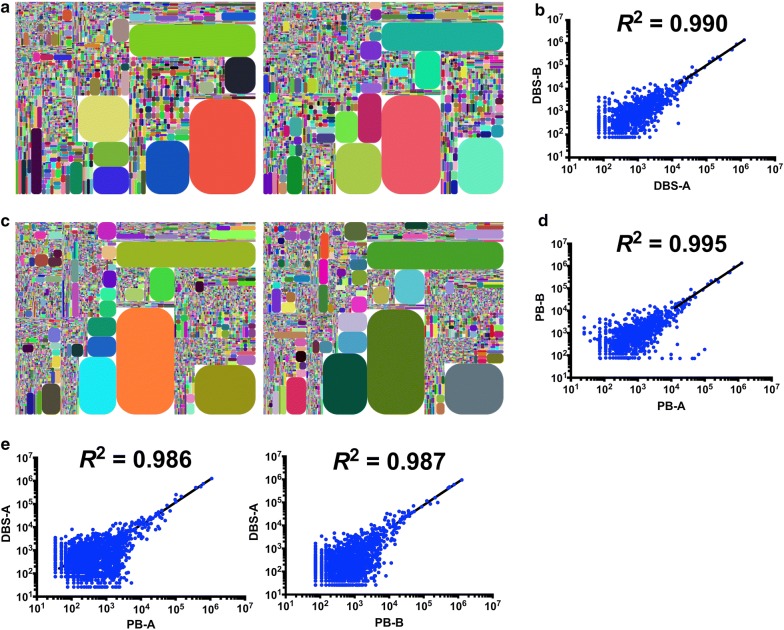
Fig. 3.
The comparison of TCRβ CDR3 between DBS and whole blood. a Tree maps of TCRβ CDR3 from duplicate DBS samples. b The coefficient of determination (R2) of linear regression in TCRβ CDR3 sequences from duplicate DBS samples. c Tree maps of TCRβ CDR3 from duplicate peripheral blood samples. d The R2 of linear regression in TCRβ CDR3 sequences from duplicate peripheral blood samples. e The R2 of linear regression in TCRβ CDR3 sequences between peripheral blood and DBS

