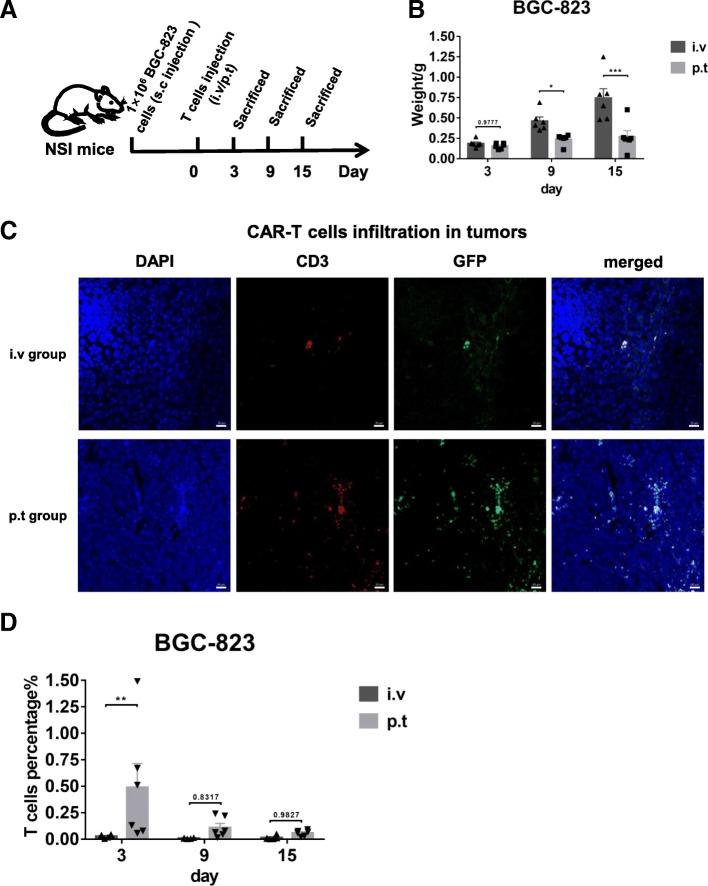
Fig. 7.
Infiltration of M28z10 T cells into GC tissue is enhanced by peritumoral delivery. a Schematic representation of the experiments. b Tumor weight of BGC-823 subcutaneously injected mice with different T cell delivery methods when sacrificed at each different time point. Error bars denote the s.e.m., and the results were compared with two-way ANOVA test. *P < 0.05; **P < 0.01; ***P < 0.001. c Representative Immunofluorescence imaging of the tumor tissue section for the BGC-823 s.c. mice with different T cell delivery methods sacrificed in day29, scale bar = 20 μm. d Detection of the percentage of tumor infiltrated T cells by FACS. Error bars denote the s.e.m., and the results were compared with two-way ANOVA test. *P < 0.05; **P < 0.01; ***P < 0.001

