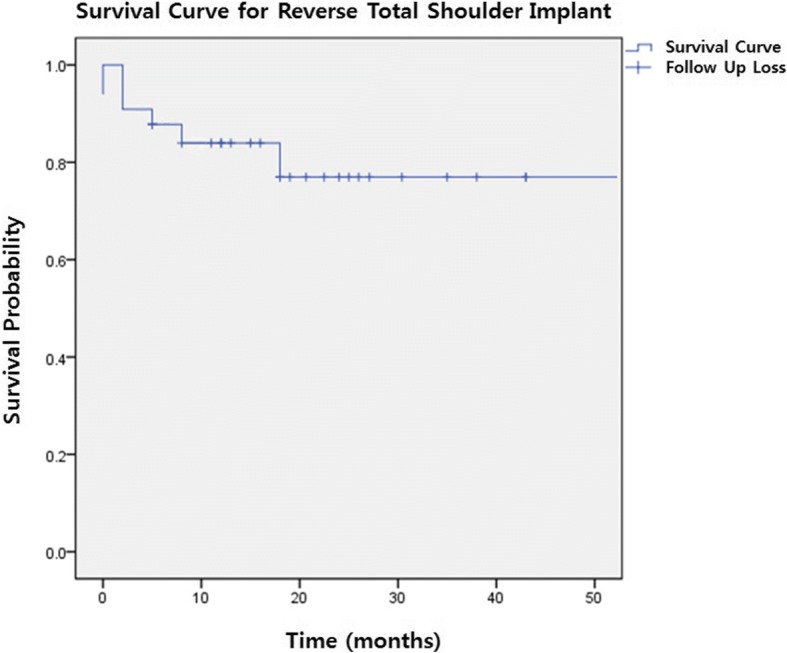
Fig. 2.

Kaplan-Meier’s survival analysis for reverse total shoulder implant. Following graph shows survival curve for RTSA implant. Survival curve is indicated with solid line. While each descent of curve implies complication, cross symbol (+) implies follow up loss of patient. The survivalship of RTSA implant was revealed to be approximately 76% throughout the follow-up period
