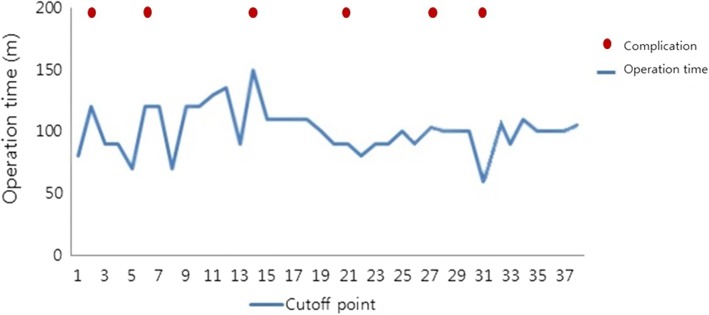
Fig. 3.
Operation time for each reverse total shoulder arthroplasty. Following graph shows the operation time for consecutive 38 cases of reverse total shoulder arthroplasty. The cutoff points were shown at every three shoulders and significant stabilized and decreased operation time was noted after 15th RTSA. As for cases with intra op, or post complication, there were no discernible pattern

