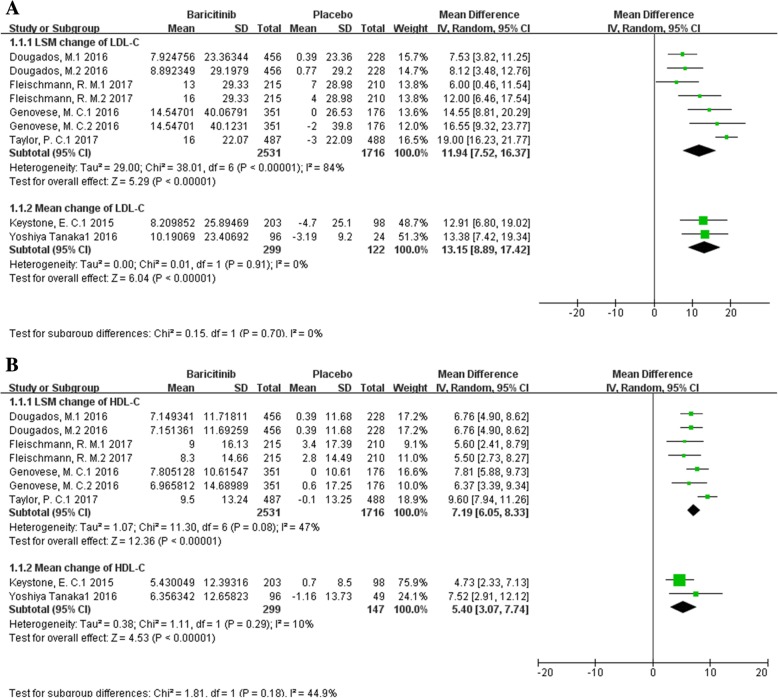
Fig. 2.
Funnel plot of the effect of baricitinib on LDL-C levels and HDL-C levels.Net change scores of LDL-C and HDL-C levels were pooled with the comparation of baricitinib versus placebo. a Pooled estimates of net change score of LDL-C level; b Pooled estimates of net change score of HDL-C level. Notes, ES, effect size; LSM, least squares mean

