
Fig. 3.
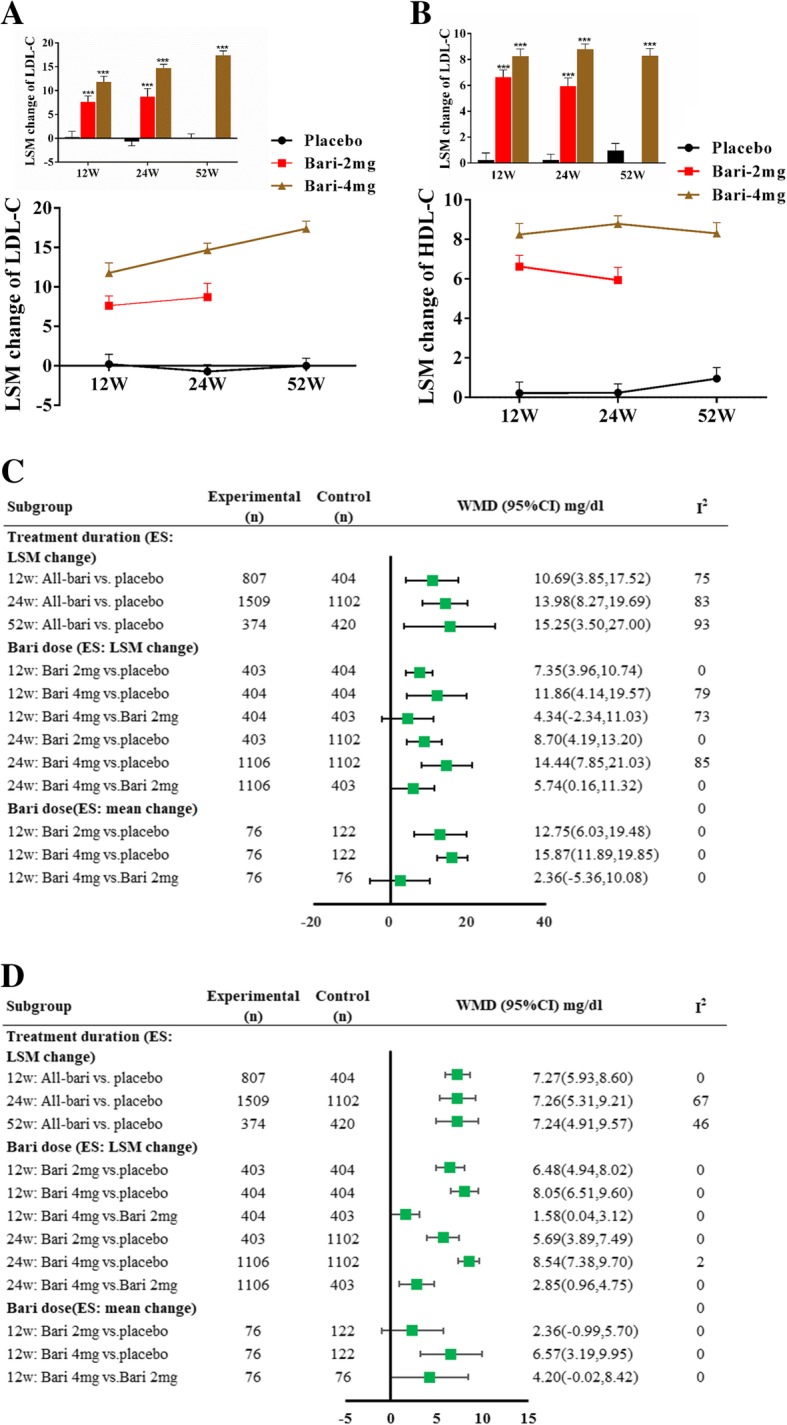
Subgroup analyses sorted by treatment dose and duration. a and b LSM changes of LDL-C and HDL-C levels across placebo, baricitinib 2 mg and 4 mg from week 12 to week 24 to baseline. Values presented as LSM ± SE. vs. placebo, *** p < 0.001; c Subgroup analysis of LDL-C changescores; d Subgroup analysis of HDL-C change scores. Notes, Bari, baricitinib; WMD, weighted mean difference; LSM, least squares mean. SE, standard error