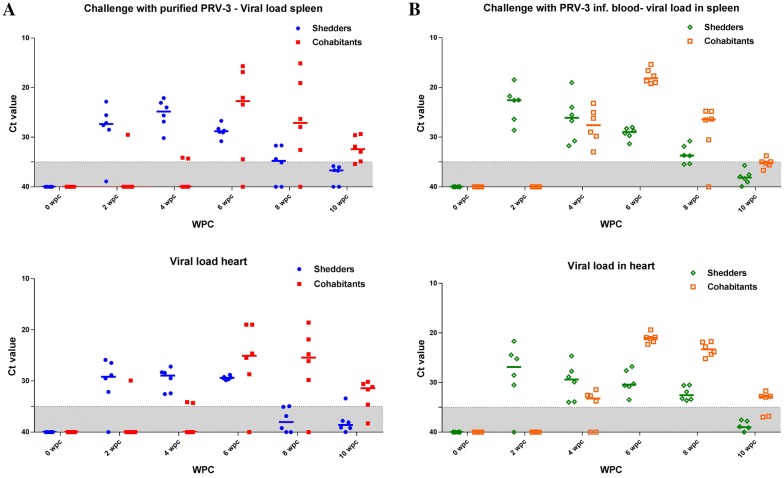
Figure 2.
PRV-3 infection kinetics. RT-qPCR of PRV-3 segment S1 in spleen and heart. Colored dots indicate Ct values of individual fish while horizontal bars show the median Ct value. Samples were considered virus positive at Ct levels below 35 and suspected between Ct 35-40 (grey shaded area); Ct values above 40 are negative. A Shedders (Blue) and cohabitants (red) in tank challenged with purified PRV-3 particles. B Shedders (green) and cohabitants (orange) in tank challenged with PRV-3 infected blood.

