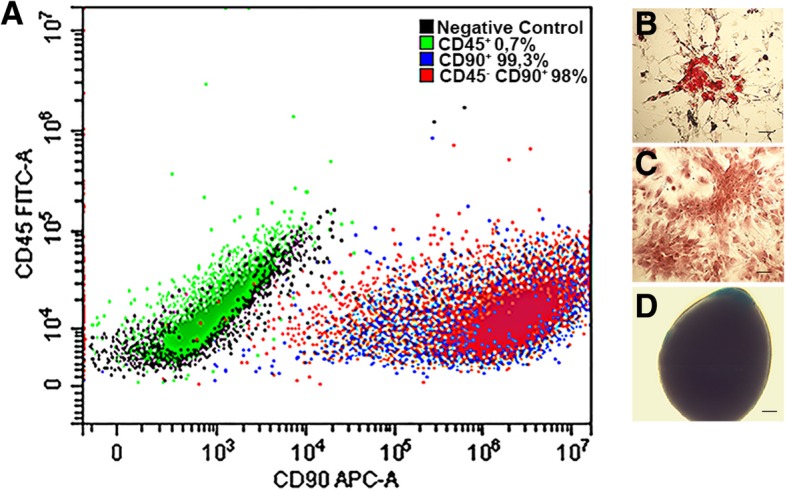
Fig. 1.

rBMSC characterization. An example of rBMSCs phenotype and functional analysis. a Flow cytometry analysis of MSCs for surface markers (CD45+ isotype control, CD90+ isotype control, negative control) showed that isolated bone marrow-derived cells expressed CD90, but not the hematopoietic marker CD45, confirming that only mesenchymal cells had been isolated (CD45−CD90+ cells population). b–d In vitro differentiation of mesenchymal cells: the cells were incubated in lineage-specific induction media and then analyzed by histochemical and cytological staining for b adipocytes (Oil Red-O staining), c osteoblasts (alizarin red staining), and d chondrocytes (Alcian Blue staining)
