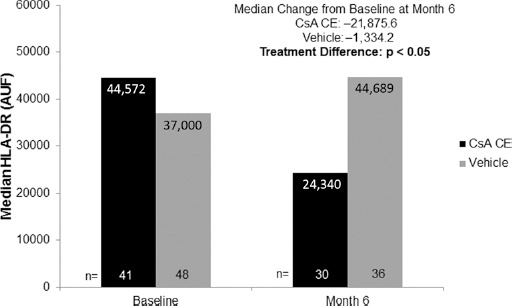
Fig. 3.

Human leukocyte antigen DR (HLA-DR) expression at baseline and after 6 months of randomized treatment with 0.1% cyclosporine A cationic emulsion (CsA CE) or vehicle. As the data distribution was found to be log-normal, median values are presented for patients present at baseline (CsA CE: n = 41, vehicle: n = 48) and at month 6 (CsA CE: n = 30, vehicle: n = 36). Median changes from baseline are from patients evaluable at baseline and at month 6 in the safety population (CsA CE: n = 24, vehicle: n = 31). The statistical comparison shown reflects an analysis of covariance on the rank-transformed value, adjusted on center effect. AUF = arbitrary units of fluorescence.
