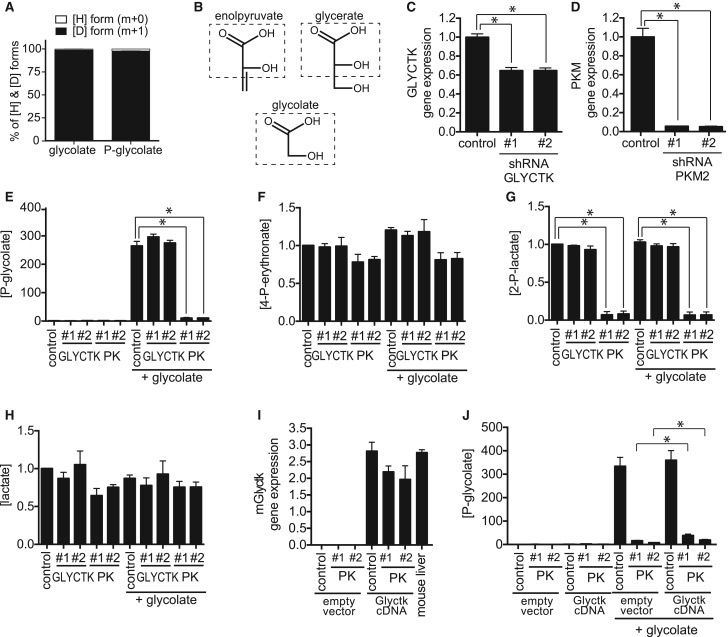
Figure 2. Phosphoglycolate is mainly formed by pyruvate kinase in the colorectal cancer cell line HCT116.
(A) Relative abundance of glycolate and phosphoglycolate isotopomers was assessed by GC/MS in PGP knockout HCT116 cells (and wild-type cells, not shown) 6 h after treatment with 5 mM deuterated glycolate. Values shown represent the contribution of 1H and 2H after correction for the contribution of the trimethylsilyl part and the carbon backbone of glycolate. (B) Similarity between glycerate, glycolate and enolpyruvate. (C,D) Relative gene expression of GLYCTK (C) and PKM2 (D) in cells treated with two different shRNAs. (E–H) Relative concentrations of phosphoglycolate (E), 4-P-erythronate (F), 2-P-lactate (G) and lactate (H) were measured by GC/MS in GLYCTK and PKM2 knockdown cell lines 6 h after addition of 5 mM glycolate. Values represent the mean ± s.e.m. of four independent experiments and were normalized within each experiment to untreated wild-type cells. (I,J) We generated PGP knockout HCT116 cells where we knocked down PKM2 and overexpressed (or not) murine Glyctk mRNA. mRNA levels were assessed in these cell lines in comparison with mouse liver (I) and are represented normalized to the abundance of U6 mRNA (means ± s.e.m., n = 3). Phosphoglycolate concentrations (J) were assessed in these cell lines and are presented normalized to untreated control cells within each experiment (means ± s.e.m. of three independent experiments). Asterisks indicate P < 0.05 in post hoc t-test analysis corrected for multiple testing.

