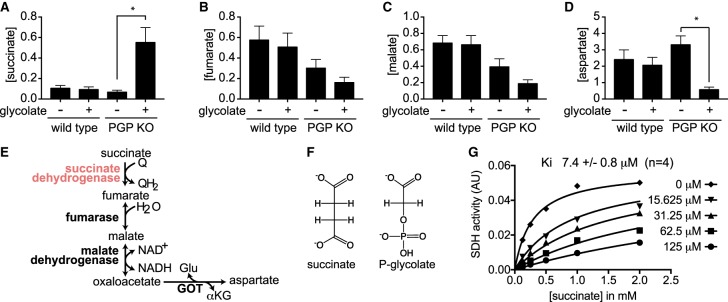
Figure 4. Phosphoglycolate blocks succinate dehydrogenase.
(A–D) Concentrations of succinate (A), fumarate (B), malate (C) and aspartate (D) were determined by GC/MS analysis of wild-type or PGP knockout HCT116 cells in the presence or absence of 5 mM glycolate for 6 h. Values represent the mean ± s.e.m. of four independent experiments and are presented normalized to total ion current in arbitrary units. Asterisks indicate P < 0.05 in post hoc t-test analysis corrected for multiple testing. (E) Schematic representation of the metabolites measured in panels (A–D) in the citric acid cycle. (F) Structural similarity of phosphoglycolate and succinate. (G) succinate dehydrogenase (SDH) activity of rat liver mitochondria was assessed in the presence of varying concentrations of phosphoglycolate and succinate. The Ki obtained from four independent experiments was 7.4 ± 0.8 µM.

