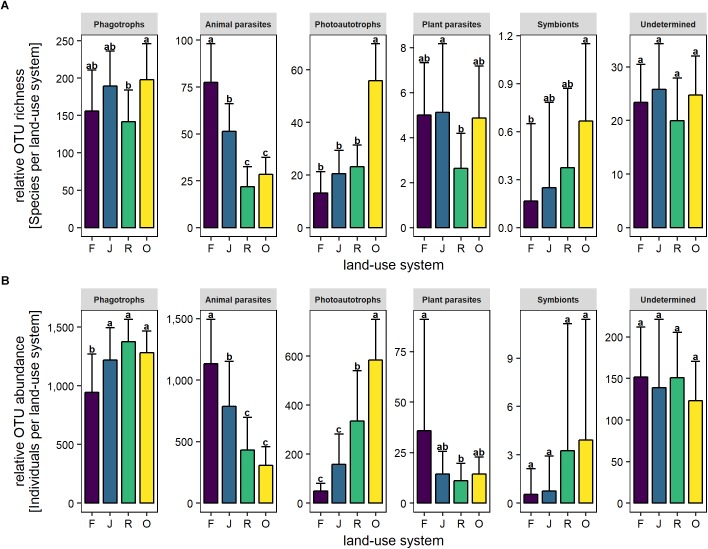
FIGURE 3.
Relative OTU richness (A) and relative OTU abundance (B) of trophic groups of protists in soil of four land-use systems: rainforest (F), jungle rubber (J), rubber plantations (R), and oil palm plantations (O). Bars sharing the same letter do not differ significantly (Tukey’s HSD test, p < 0.05).

