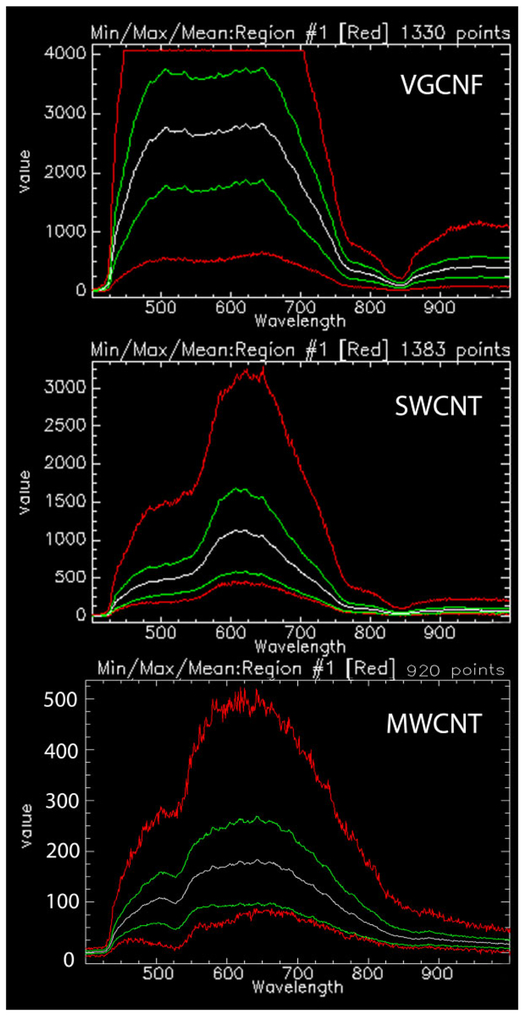
Figure 5.
Comparison of hyperspectral images of vapor grown carbon nanofiber (VGCNF), single-wall carbon nanotube, and multiwalled carbon nanotube. Graph shows screen image captures of the results for hyperspectral analysis of three related nanomaterials. Each image shows the intensity of scattered light for the pixels (points) of 20 to 30 nanoparticles versus wavelength from 400 to 1,000 nm. Multiple curves are shown for the scan to demonstrate the mean, range, and maximum and minimum at each wavelength. The white scan curve in each image is the mean of all pixels (points). The green curves are the 2 standard deviation range of pixel values. The red top and bottom curves of each nanoparticles scan correspond to the maximum and minimum pixels values encountered in the nanoparticles. The flat top of the VGCNF maximum scan (red curve) demonstrates that some pixels were saturated in that scan and would need to be repeated in normal operation. The three mean and range curves of these nanoparticle scans show significant differences in the peak wavelength of the scattered light and general shape, which can be used to identify each nanoparticle in a tissue section containing a mixture of the three nanomaterials.

