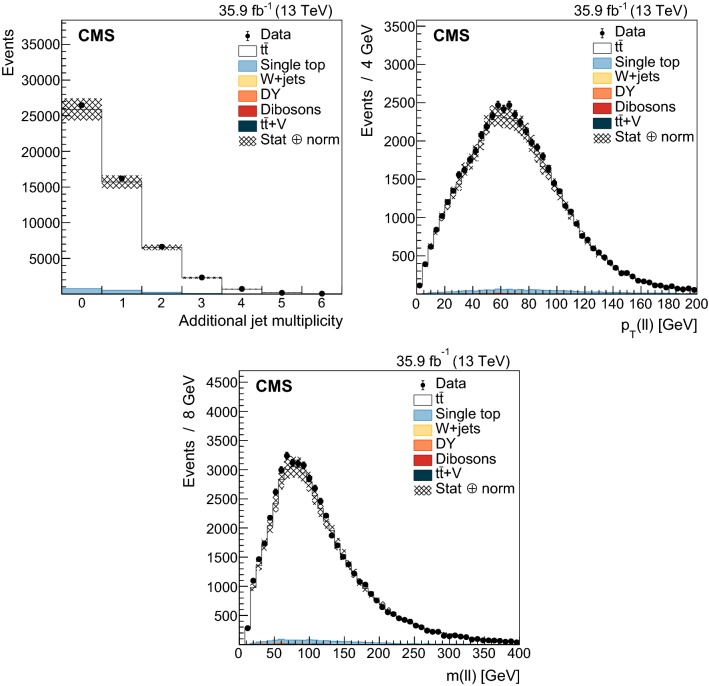
Fig. 2.
Distributions of the variables used to categorize the study of the UE. Upper left: multiplicity of additional jets (). Upper right: . Lower: . The distributions in data are compared to the sum of the expectations for the signal and backgrounds. The shaded band represents the uncertainty associated to the integrated luminosity and the theoretical value of the cross section

