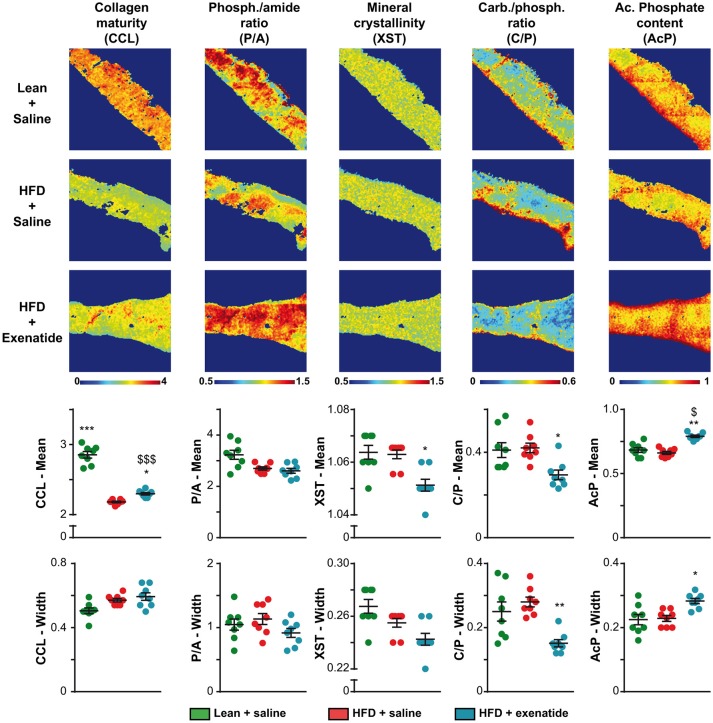
Figure 3.
Effects of HFD-induced diabetes and treatment with exenatide on bone compositional parameters. Bone composition parameters were assessed by Fourier transform infrared imaging (FTIRI) at the posterior quadrant of the femur. Some FTIRI images, representing the overall stitching of nine consecutive field-of-views, are presented. The pseudo-color represents the degree of each parameter overall the full width of the cortical bone. The mean and width at half maximum, representing the mean and heterogeneity, respectively, of each parameter was also investigated and represented below FTIRI images. Values are means ± SEM for 8 mice. *p < 0.05, **p < 0.01, ***p < 0.001 vs. HFD + saline. $p < 0.05, $$$p < 0.001 vs. Lean + saline.

