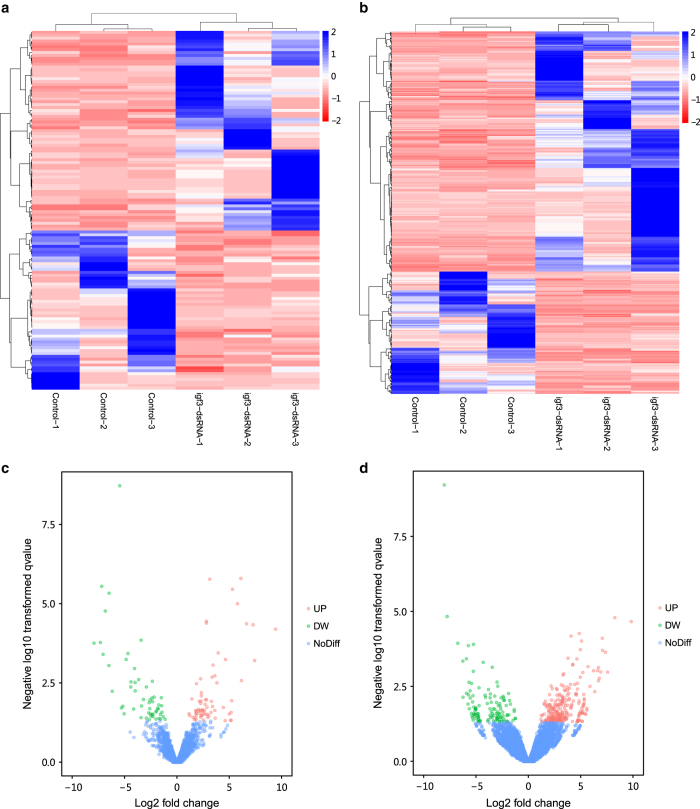
Figure 3. Differentially expressed lncRNAs and mRNAs.
(a and b) are hierarchical clustering of the differentially expressed lncRNAs and mRNAs, blue indicates relative high expression, and red indicates relative low expression. (c and d) are volcano plots of differentially expressed lncRNAs and mRNAs. X-axis represents fold change (log 2) and Y-axis represents P (−log 10). Red points indicate up-regulated (UP, X-axis > 0) transcripts; green points indicate down-regulated (DW, X-axis < 0) transcripts; blue points indicate no significant difference (NoDiff).

