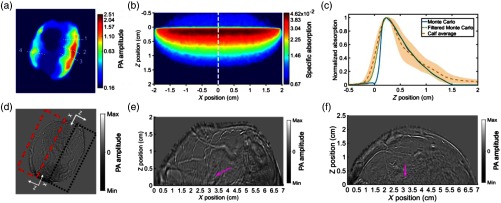
Fig. 4.
Analysis of the maximum imaging depth and 1064-nm light absorption in muscular tissue. (a) Cross-sectional image of the volunteer’s upper right calf, where vessels and other sharp features were removed using morphological background detection.34 (b) Image of the simulated specific absorption (in relative units of ) in muscular tissue. In both (a) and (b), the lower bound of the color scale was truncated to the water’s average value. (c) Normalized depth-resolved comparison between the simulated-specific absorption in muscular tissue along the white dashed line in (b), before (blue curve) and after (dotted green) applying the background removal filter to the Monte Carlo model, and the experimental average-specific absorption in the volunteer’s upper right calf (dashed orange curve) from the four white dotted line profiles in (a). The shaded orange area is the region within one standard deviation of the experimental mean from the four dotted line profiles in (a). The curves were normalized such that the minimum value coming from the water region was set to zero and the maximum value inside the (simulated) tissue was set to one. (d) Fluence compensated unfiltered single-shot cross-sectional image of the volunteer’s upper right calf using latitudinal mode illumination. Fluence compensation was performed using the approximate fluence distribution in (a). (e) Magnified region of the volunteer’s calf inside the black-dotted rectangle in (d), using the upper right coordinate system. (f) A close-up view of the region outlined by the red-dashed rectangle in (d), using the bottom left coordinate system.

