
Figure 4.
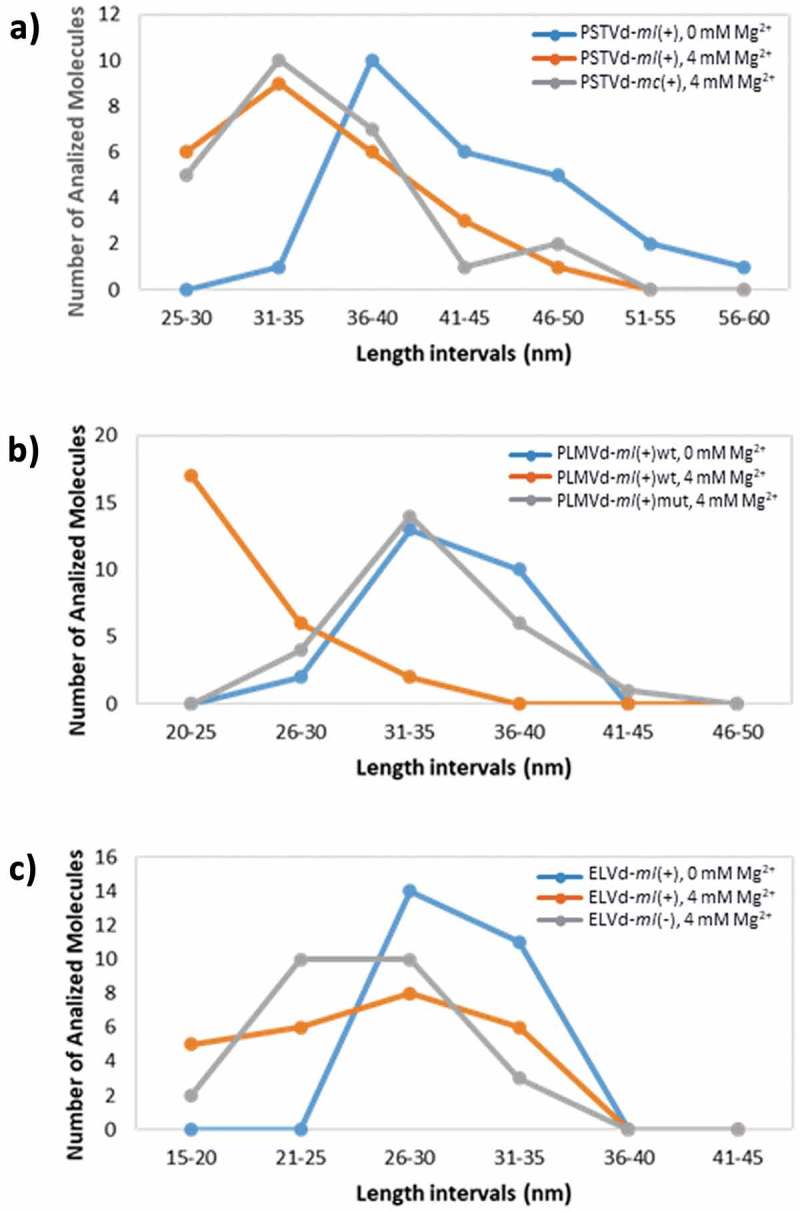
Length distribution of the imaged single molecules of PSTVd (A), PLMVd (B) and ELVd (C) at 0 and 4 mM Mg2+. Length intervals of 5 nm have been used for the comparative analysis of all the viroid variants.
Official websites use .gov
A
.gov website belongs to an official
government organization in the United States.
Secure .gov websites use HTTPS
A lock (
) or https:// means you've safely
connected to the .gov website. Share sensitive
information only on official, secure websites.
Length distribution of the imaged single molecules of PSTVd (A), PLMVd (B) and ELVd (C) at 0 and 4 mM Mg2+. Length intervals of 5 nm have been used for the comparative analysis of all the viroid variants.