Figure 1.

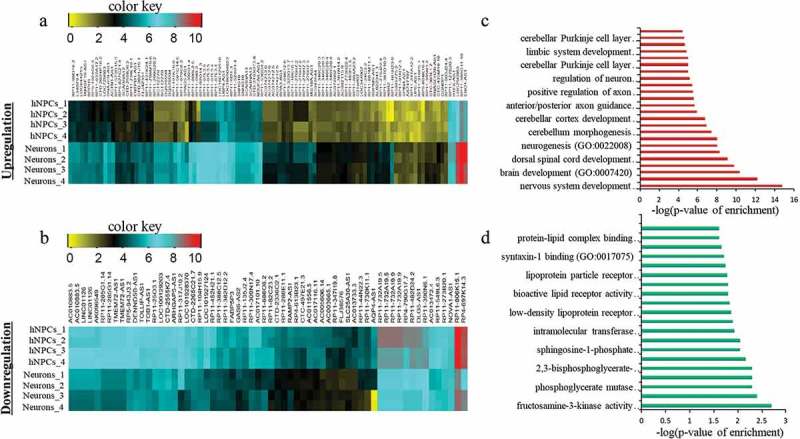
Identification of DELs in neuronal differentiation of hNPCs. (a–b) represents the heatmap of upregulated and downregulated DELs respectively. (c–d) shows GO analysis of upregulated and downregulated DELs respectively.

Identification of DELs in neuronal differentiation of hNPCs. (a–b) represents the heatmap of upregulated and downregulated DELs respectively. (c–d) shows GO analysis of upregulated and downregulated DELs respectively.