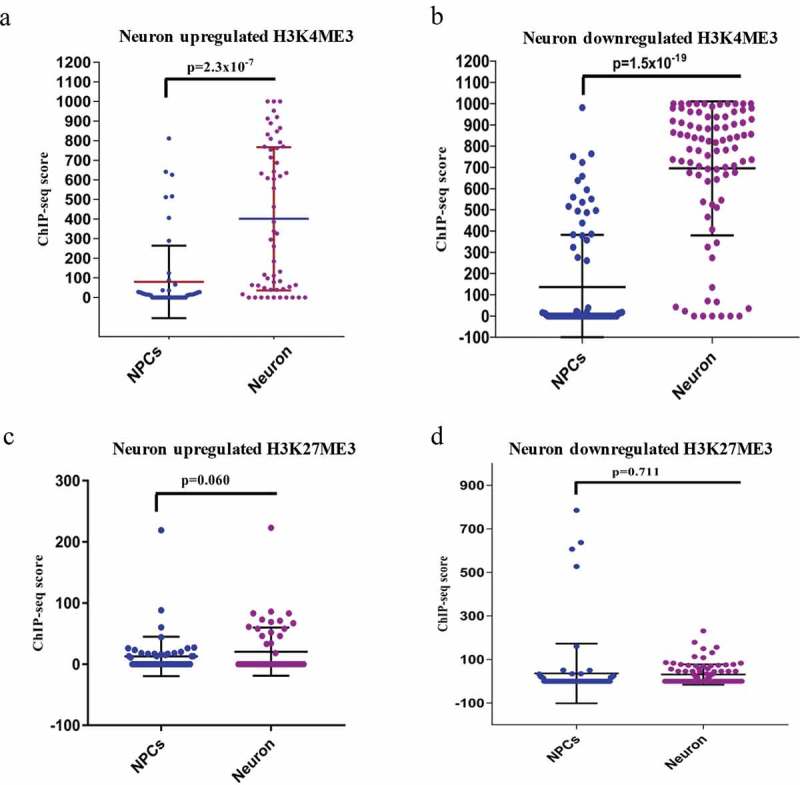
Figure 2.

ChIP-seq analysis of H3K4me3 and H3K27me3 of DELs during neuronal differentiation. (a–b) shows the ChIP-seq scores of H3K4me3 of upregulated (p ≤ 2.3 × 10⁻⁷) and downregulated (p ≤ 1.5 × 10⁻¹⁹) DELs. (c–d) shows the ChIP-seq scores of H3K27me3 of upregulated (p ≤ 0.06) and downregulated (p ≤ 0.7) DELs.
