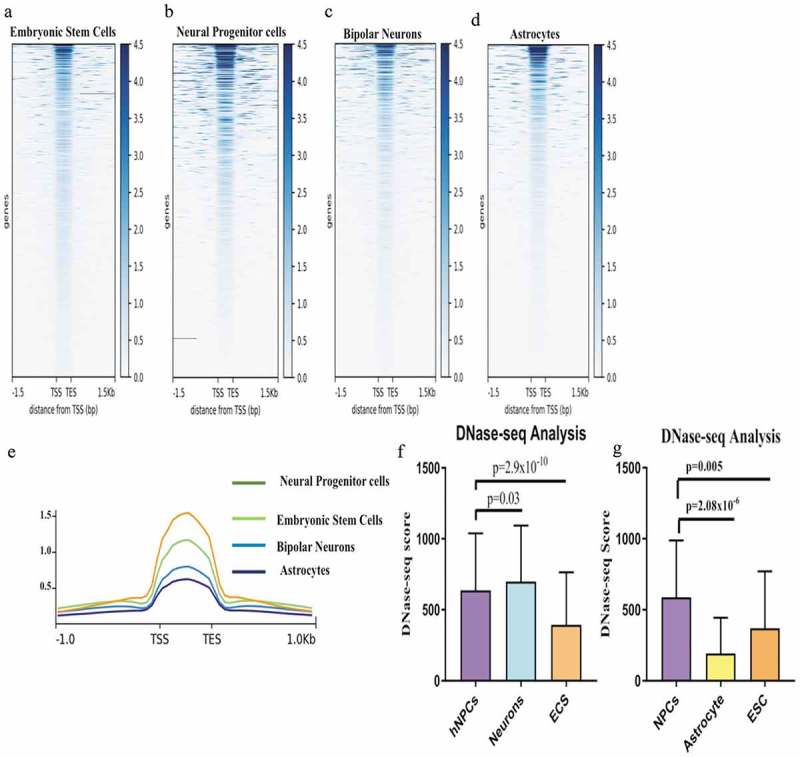
Figure 7.

Comparision of Euchromatinization using DNase-seq data in hESCs, hNPCs, neuron and astrocytes. (a–d) Heatmaps of DNase-seq Reads Per Kilobase Million (RPKM) in hESCs, hNPCs, neurons and astrocytes of ENCODE datasets. (e) showing enrichment scores using plotprofile of each cell types, (f) Comparision of DNase-seq scores of dELs in hNPCs, Neurons and ESCs, (g) Comparision of DNase-seq scores of dELs in hNPCs, Astrocytes and ESCs.
