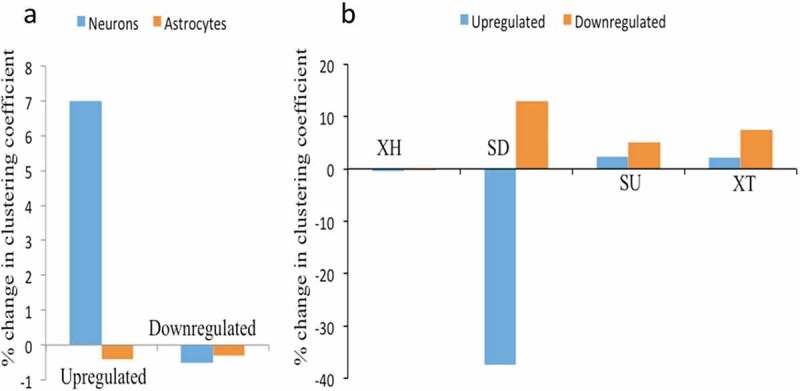
Figure 8.

Network analysis of XH lncRNAs and other biotypes during hNPCs differentiation. (A) showing change in clustering coefficient during neuronal differentiation and astroglial differentiation in upregulated and downregulated DELs, XH lncRNAs shows increase in network strength only during neuronal differentiation of hNPCs, (B) showing change in clustering coefficient of other lncRNAs biotypes during astroglial differentiation of hNPCs, SD biotypes shows the maximum changes in network strength during astroglial differentiation.
