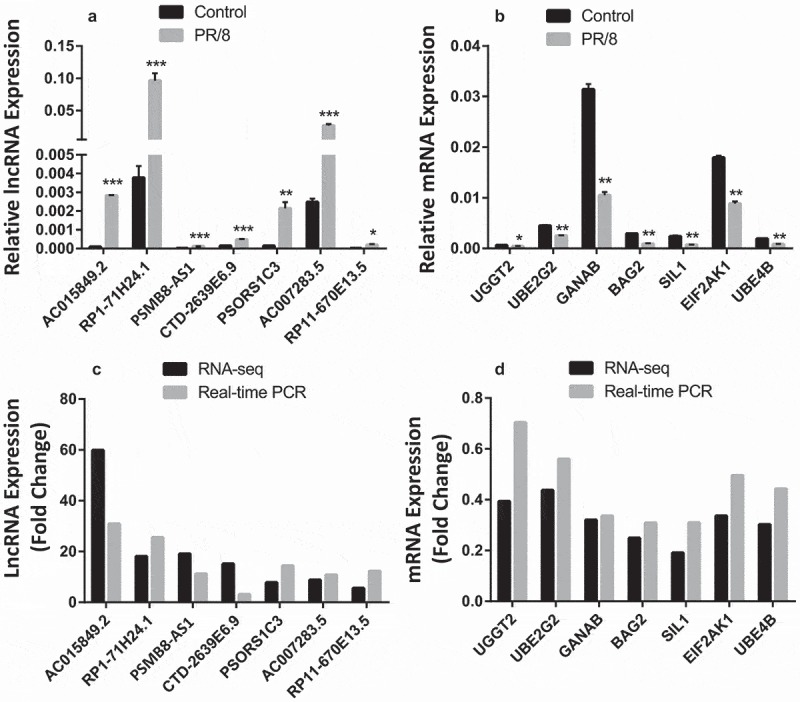
Figure 3.

Validation of RNA-seq results with real-time PCR. (a, b) Relative expression of selected lncRNAs and mRNAs performed on the same samples as for RNA-seq using real-time PCR. Data was normalized to β-actin and expressed as means ± SE. n = 3 independent experiments. *p < 0.05, **p < 0.01, and ***p < 0.001 vs. control (paired student’s t-test). (c, d) Fold changes as determined by RNA-seq and real-time PCR.
