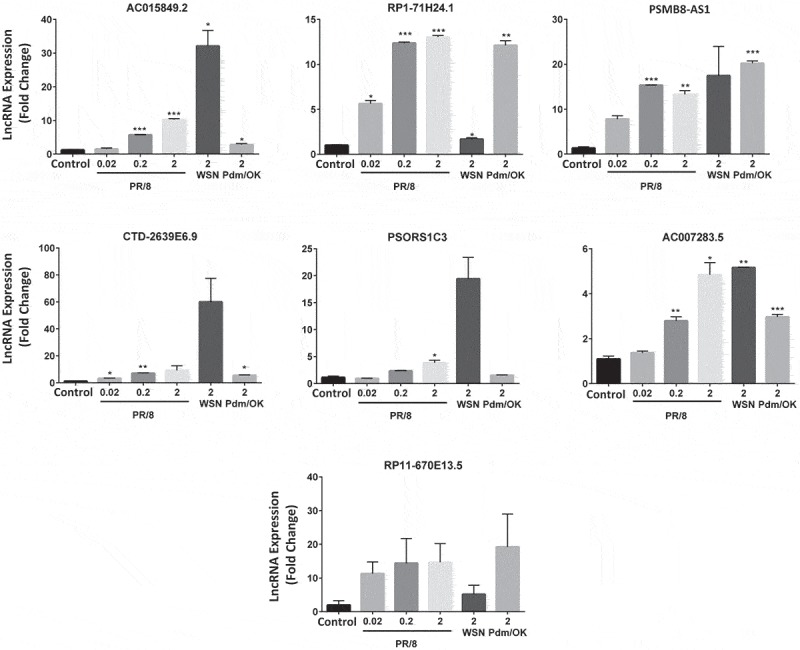
Figure 4.

lncRNA induction by different influenza viruses. A549 cells were infected with influenza A viruses, PR/8 (MOI: 0.02, 0.2 and 2), WSN (MOI 2) and Pdm/OK (MOI 2) for 24 h. lncRNA expression levels were determined by real-time PCR and normalized to β-actin to determine ΔΔct. Results are represented as means ± SE from three independent experiments. *p < 0.05, **p < 0.01 and ***p < 0.001 vs. mock control (One-way ANOVA post hoc Dunnett).
