Figure 1.

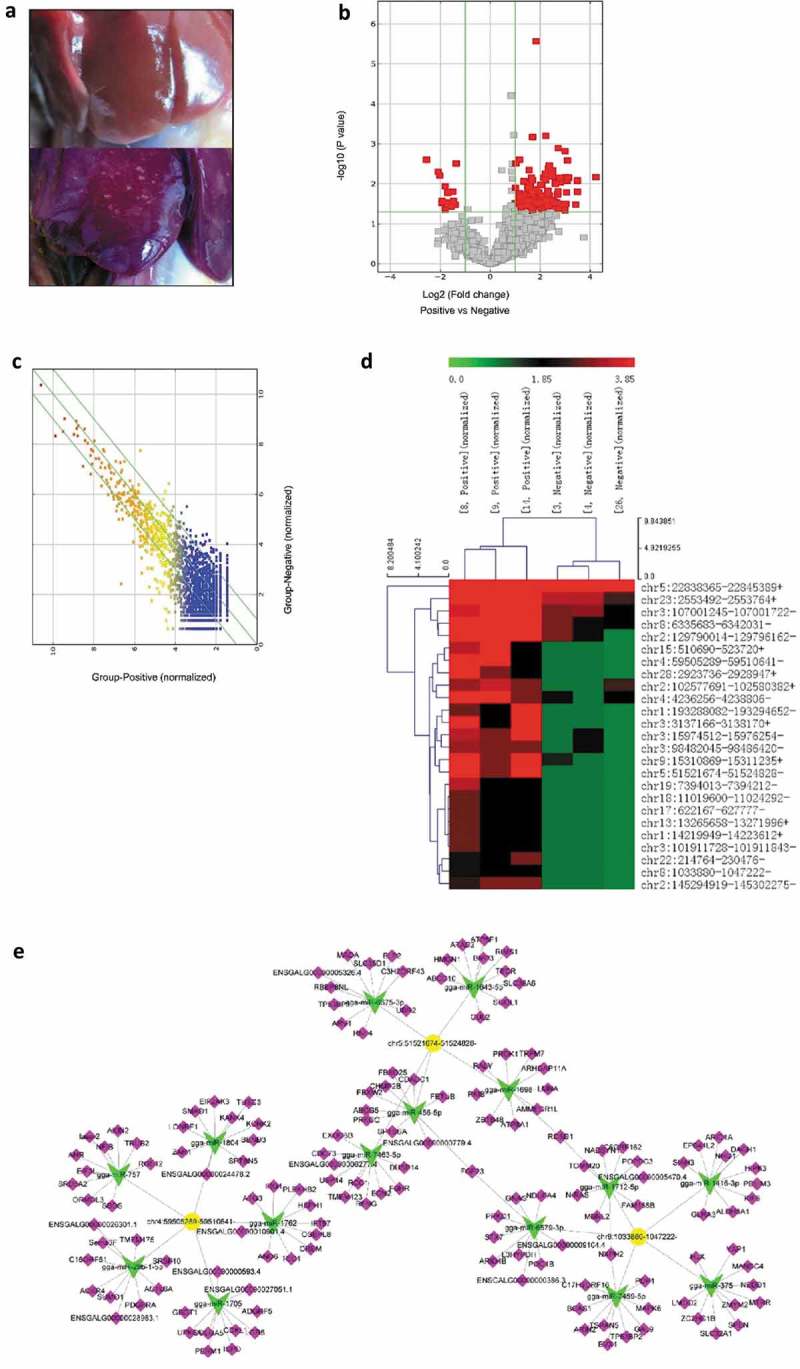
Bioinformatics analysis of differentially expressed circRNAs in tumor livers of ALV-J-susceptible chickens and normal livers of ALV-J-resistance chickens. (a) Normal liver (up) and tumor liver (down) in chickens infected with ALV-J. (b) Volcano plot of differentially expressed circRNAs in tumor livers and normal livers. (c) Scatter plot of differentially expressed circRNAs in tumor livers and normal livers. (d) Heap map for the 25 most significant differentially expressed circRNAs in tumor livers from circular RNA sequencing data. Sample [8,14] and [9] represent ALV-J-susceptible chickens [3,4]; and [26] represent ALV-J-resistant chickens. The numbers 0.0, 1.85 and 3.85 on the top represent the expression levels of the circRNAs. Each row represents a circRNA; each column represents one sample. Dendrograms produced by clustering analysis of the samples are shown on the top. (e) Predicted biomathematical circRNA-miRNA-gene network for the three-selected upregulated circRNAs, including circ-Vav3 (chr8:1033880–1047222-), in ALV-J-induced tumor livers. Yellow represents circRNAs, green represents miRNAs and pink represents miRNA target genes.
