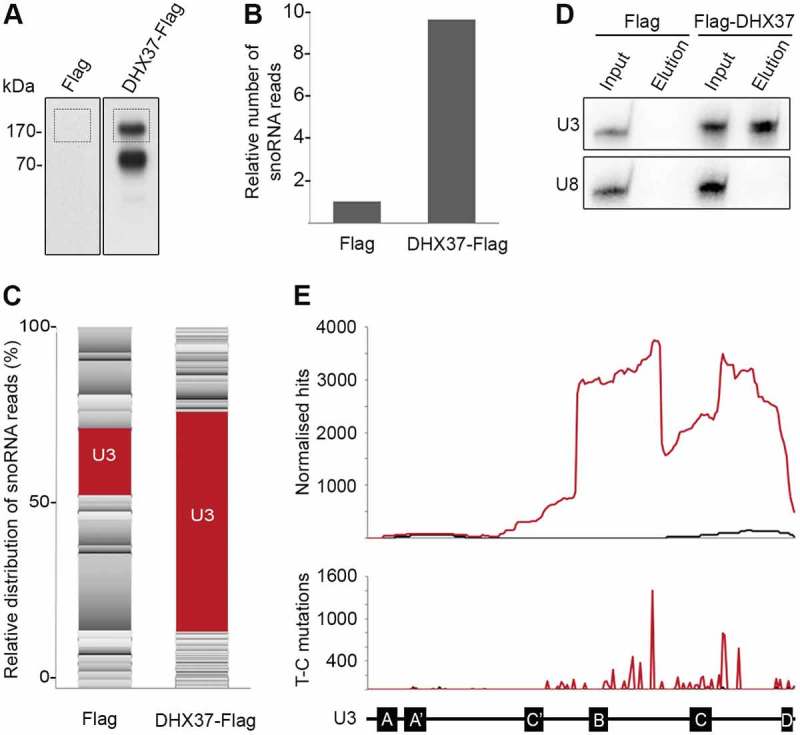
Figure 4.

DHX37 associates with the 3ʹ region of the U3 snoRNA that contains the box C/D motifs. (a) HEK293 cells expressing DHX37-Flag or the Flag tag were grown in the presence of 4-thiouridine before crosslinking in vivo using light at 365 nm. RNA-protein complexes were tandem affinity purified under native and denaturing conditions, then RNAs co-purified with DHX37 were ligated to sequencing adaptors and labelled using [32P]. Complexes were separated by denaturing PAGE, transferred to a nitrocellulose membrane and labelled RNAs were detected by autoradiography. The regions of the membrane excised for subsequent analysis are indicated by boxes. (b) The region of the membrane containing DHX37-Flag-RNA complexes as indicated in (a), and a corresponding region of the lane containing the Flag sample, were excised. RNAs were isolated and subjected to reverse transcription and PCR amplification to generate a cDNA library upon which Illumina deep sequencing was performed. The obtained sequence reads were mapped to the human genome and, after normalization, the relative number of reads derived from snoRNAs in the Flag and DHX37-Flag samples was determined. (c) The relative distribution of sequence reads derived from each box C/D snoRNA in the Flag and DHX37-Flag datasets is shown. The proportion of sequence reads mapping to the U3 snoRNA is highlighted in red while all other snoRNAs are shown in shades of grey. (d) Cell extracts prepared from HEK293 cells expressing Flag-DHX37 or the Flag tag were incubated with anti-Flag beads. After thorough washing steps, complexes were eluted and RNA was extracted. RNAs extracted from inputs (1%) and eluates were separated by denaturing PAGE, transferred to a nylon membrane and northern blotting was performed using probes hybridizing to the U3 and U8 snoRNAs. RNAs were detected using a phosphorimager. (e) The normalized number of reads mapping to each nucleotide of the gene encoding the U3 snoRNA in the Flag (black) and DHX37-Flag (red) datasets is shown graphically (upper panel). The normalized number of mutations mapping to each position are indicated in the lower panel. A schematic representation of the U3 snoRNA is shown below with the relative positions of key features indicated.
