
Figure 1.
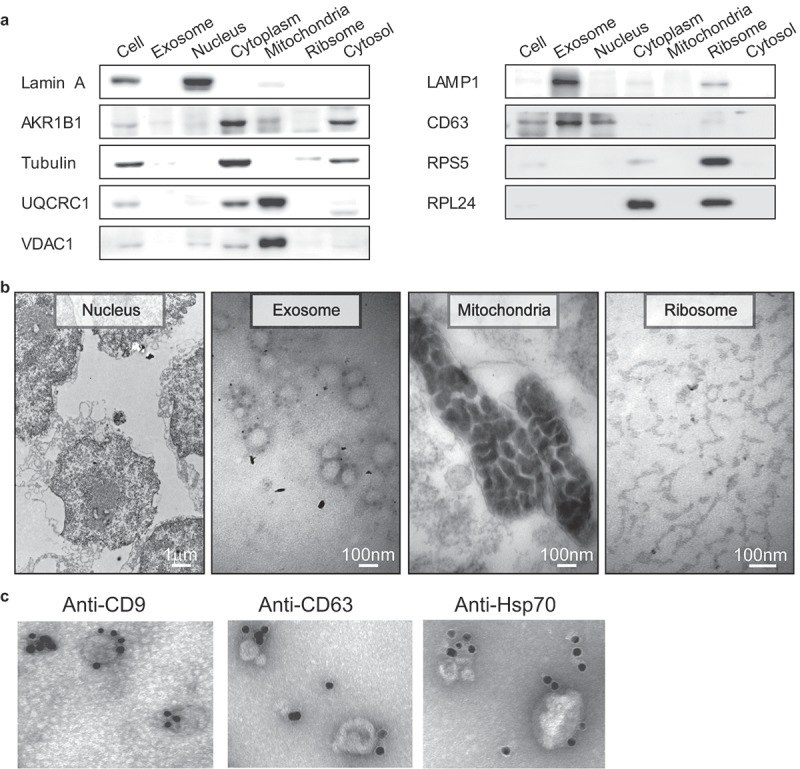
Western blot and representative TEM images for the subcellular fractions of HepG2 cells and Immunogold electron microscopy images showing the localization of exosomes. (a) Western blot analysis of the purified subcellular fractions. The six purified subcellular fractions of HepG2 cells were verified by western blot analysis using specific detection antibodies (Lamin A: nuclear marker; AKR1B1 and tubulin: cytoplasm marker; UQCRC1 and VDAC1: mitochondria marker; LAMP1 and CD63: exosome marker; RPS5 and RPL24: ribosome marker). (b) Representative TEM images of the purified subcellular fractions (Scale bar: 1 µm for the nucleus, 100 nm for all others). (c) The first TEM image shows the localization of exosomes derived from HepG2 cells as controls. The other three TEM images show the localization of exosomes by TEM coupled to immunogold labeling of CD9, CD63 and Hsp70. The arrows indicate the golden particles.