
Figure 2.
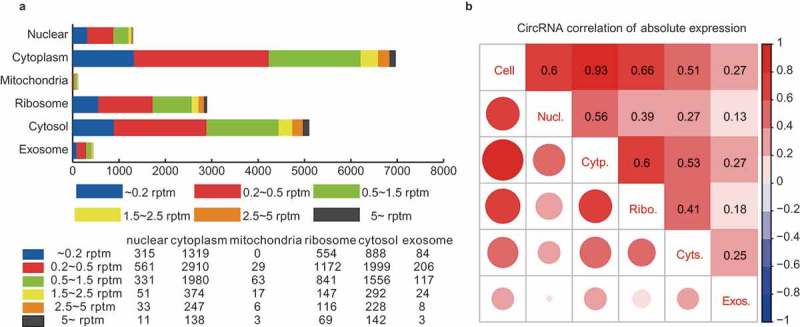
Comparative transcriptome analysis of circRNAs among the subcellular fractions. (a) CircRNA expression profile among the subcellular fractions. The number of circRNAs expressed at various cutoff expression levels is represented by the indicated colors. (b) Correlation matrix of the circRNA expression among the fractions. The size and color intensity of red circles indicate the relative strength of the correlation between the fractions.