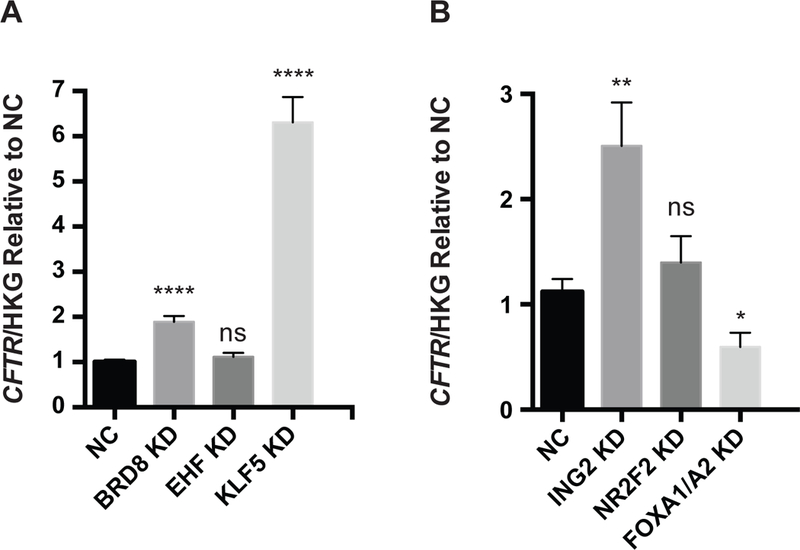
Figure 4. Depletion of KLF5, BRD8 and ING2 enhance CFTR transcript levels in HBE cells.

siRNA-mediated depletion (KD) of A) BRD8, EHF, KLF5 and B) ING2, NR2F2, enhances CFTR mRNA abundance. RT-qPCR measurements of CFTR normalized to the geometric mean of three house-keeping gene controls, β2 microglobulin (β2M), phosphoglycerate kinase (PGK) and β actin (ACTB) and shown relative to negative control (NC). Bar shows standard error of the mean. Key: not significant, ns. P>0.05, * P< 0.05, ** P<0.01, **** P<0.0001 by an unpaired two-tailed Student’s t test.
