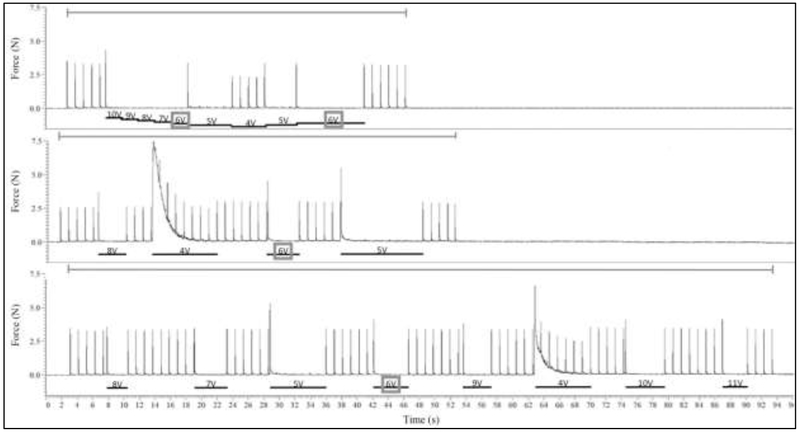
Figure 2:
Example of three trials evaluating four different block threshold methods. Force is shown in Newtons. All these three trials evaluated a 20 kHz KHFAC blocking waveform. The top graph displays a typical trial for Methods 1 (High-Low) and 3 (High-Low-High). The blocking waveform is initiated at 10 V to determine block threshold using the High-Low Method, and then once block threshold is passed the blocking amplitude is lowered by 2 V and then increased again and block threshold is re-determined through the High-Low-High Method. The middle graph displays a typical trial for Method 2, the Binary Method. Blocking amplitude begins at 8 V. The bottom graph displays a typical trial for Method 4, the Random Method. The gray bars above each graph indicate when proximal stimulation was being delivered. The black bars below each graph and accompanying text indicate the duration and amplitude of the block. A gray box shows the determined block threshold, 6 V for all cases in this example.

