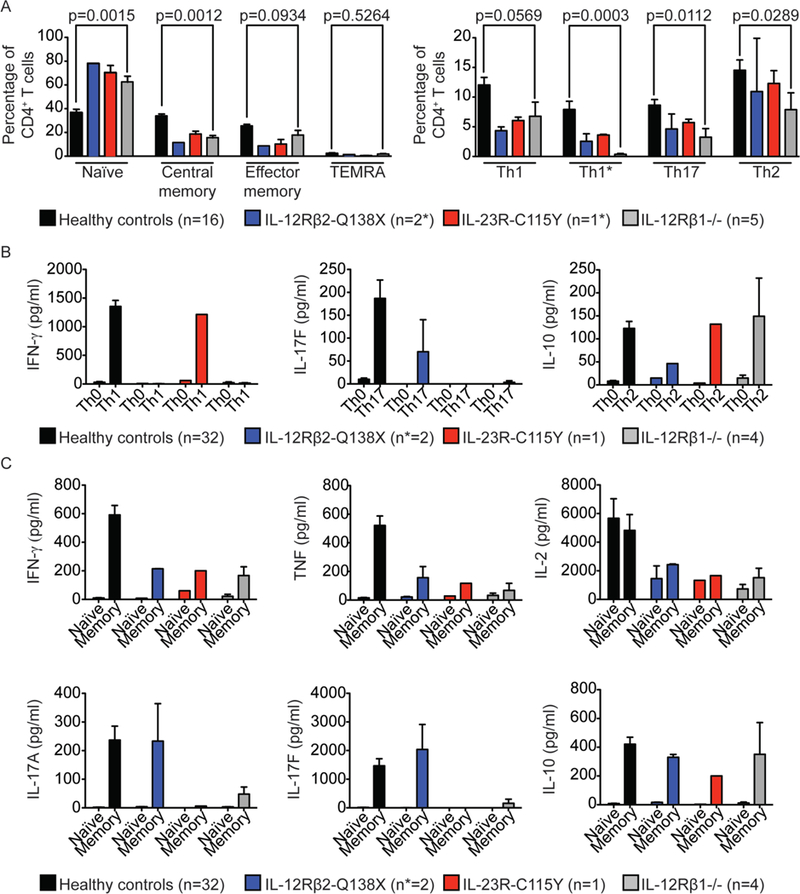
Figure 3: Frequencies and responses of CD4+ T cells from IL-12Rβ1-, IL-12Rβ2- and IL-23R-deficient individuals to polyclonal stimuli or Th-polarizing cytokines.

A) On the left, frequencies of naive (CCR7+CD45RA+), central memory (CCR7+CD45RA−), effector memory (CCR7−CD45RA−) and TEMRA (CCR7−CD45RA+) CD4+CD3+ T cells were measured in healthy controls (n=16), IL-12Rβ2-Q138X patients (n=2, one measured twice), one IL-23R-C115Y patient (technical triplicates) and rL-12Rβ1−/− patients (n=5). The values shown are the percentage of total CD4+ T cells. On the right, frequencies of four subsets of CD4+ memory T cells (CD3+CD45RA−): Th1 (CCR6−CCR4−CXCR3+), Th1* (CCR6+CCR4−CXCR3+), Th17 (CCR6+CCR4+CXCR3−) and Th2 (CCR6−CCR4+CXCR3−) were measured in the same individuals as in the left panel. Error bars indicate the SEM. P values for the comparison of healthy controls with IL-12Rβ1-deficient patients in Mann-Whitney U-tests are shown. Formal statistical comparisons including IL- 12Rβ2-Q138X and IL-23R-C115Y patients were not appropriate, due to the extremely small number of individuals (2 and 1, respectively). B) Naïve CD4+ T cells from healthy controls, two IL-12Rβ2-Q138X patients (P1 and P2), one IL-23R-C115Y patient (P4) and four IL- 12Rβ1 -deficient patients were either left unpolarized (Th0) or were polarized under Th1 conditions (TAE+IL-12), Th17 conditions (TAE+IL-1/IL-6/IL-21/IL-23/TGF-β), or Th2 conditions (TAE+IL-4). The production of IFN-γ, IL-17F and IL-10 was measured with cytometric bead arrays, in cell culture supernatants, after 5 days. C) Naïve and memory CD4+ T cells from healthy controls, two IL-12Rβ2-Q138X (P1 and P2), one IL- 23R-C115Y (P4) and four IL-12Rβ1-deficient patients were stimulated with TAE beads, and cytokine production was measured 5 days later. Data for the production of IFN-γ, TNF and IL-2 are shown in the upper panels and for IL-17A, IL-17F and IL-10 in the lower panels.
