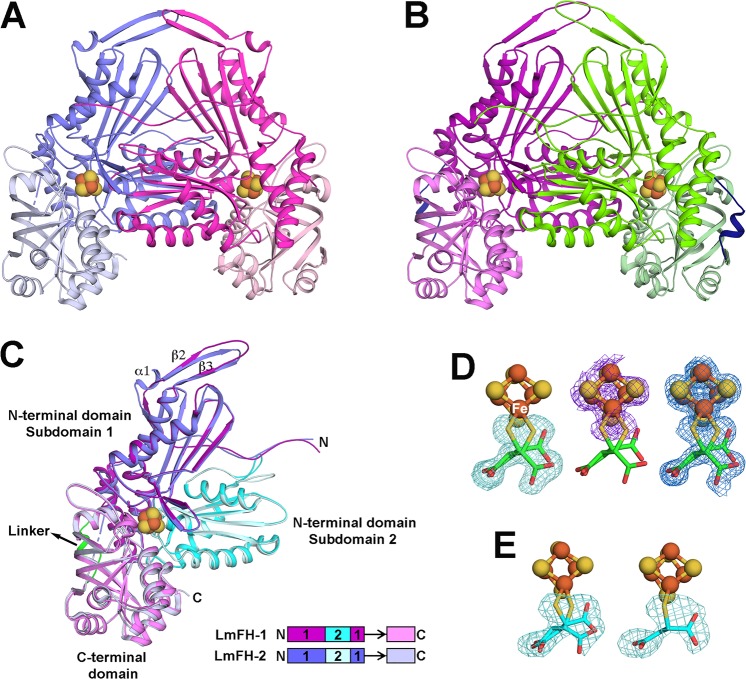
Figure 2.
Crystal structures of LmFH isoforms in a complex with 2-thiomalate. (A) Overall structure of cytosolic LmFH-2 functional dimer. Monomers are shown in blue (chain A) and pink (chain B) and are comprised of two domains: N-terminal domain (darker blue and pink) and C-terminal domain (lighter blue and pink) connected by a flexible linker. (B) Overall structure of mitochondrial LmFH-1 functional dimer. Monomers are shown in purple (chain A) and green (chain B). N-terminal domain is shown in darker purple and green, and C-terminal domain is shown in lighter purple and green. The domain linker is shown in dark blue. (C) Ribbon diagram of the superposition of LmFHs monomers (chain A). The N-terminal domain is divided into two nonsequential subdomains 1 (purple in LmFH-1 and blue in LmFH-2) and 2 (cyan in LmFH-1 and light cyan in LmFH-2), connected to C-terminal domain (light purple in LmFH-1 and light blue in LmFH-2) by a linker (green in LmFH-1 and black arrow in LmFH-2 to where linker would be if it was ordered). Linear schematic indicates subdomain order. (D) LmFH-2 in a complex with S-2-thiomalate. The left panel shows the Fo – Fc difference electron density map contoured at 3.0 rmsd (green mesh) for S-2-thiomalate (green) suggesting its double conformation. The center panel shows the sulfur anomalous difference electron density map contoured at 3.0 rmsd (purple mesh) supporting the assignment of S-2-thiomalate (green) double conformation. The C2-thiol groups (yellow) are coordinated to the unique Fe (labeled in white) of the [4Fe-4S] cluster. The right panel shows the final 2Fo – Fc electron density map contoured at 1.5 rmsd (blue mesh) for S-2-thiomalate (green) and [4Fe-4S] cluster. (E) LmFH-1 in a complex with S-2-thiomalate. The left panel shows the Fo – Fc difference electron density map contoured at 3.0 rmsd (green mesh) for S-2-thiomalate (cyan) in chains A and B, consistent with a double conformation. The right panel shows the Fo – Fc difference electron density map contoured at 3.0 rmsd (green mesh) for S-2-thiomalate (cyan) in chains C and D, consistent with a single conformation. The catalytic [4Fe-4S] clusters are shown in orange (Fe) and yellow (S) spheres.

