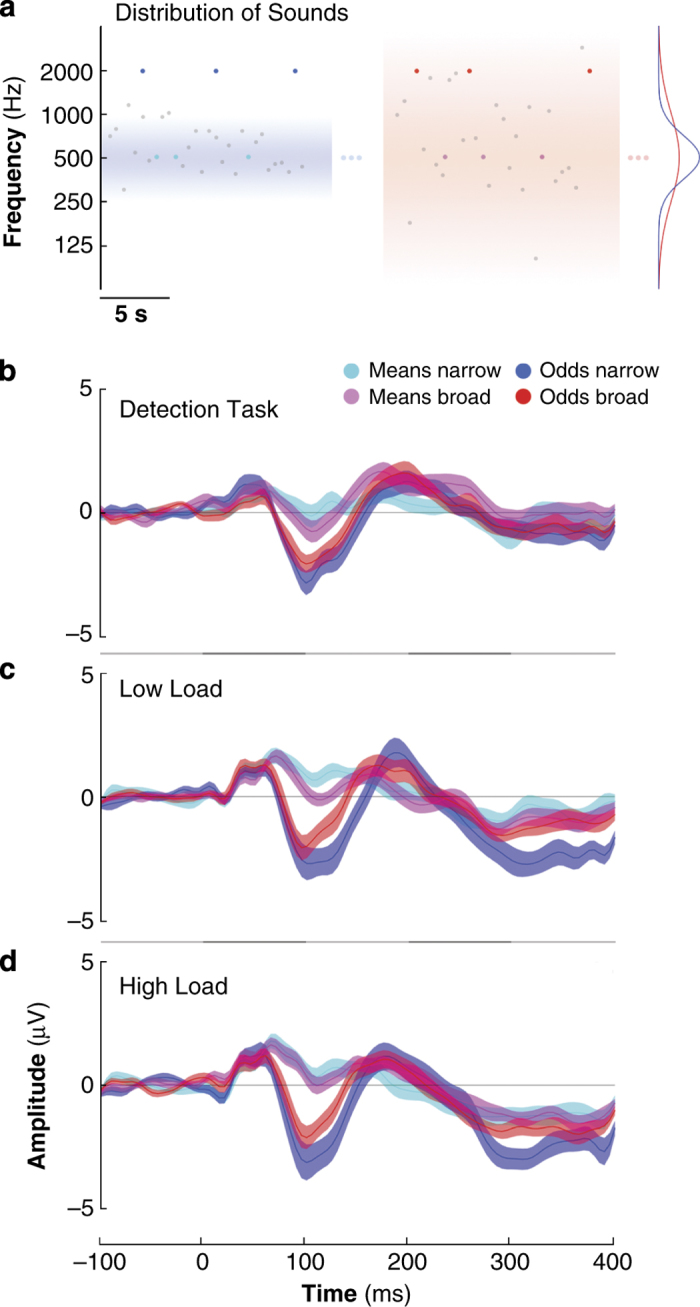
Figure 1.

Stimulus distributions and prediction error responses. (a) Stimuli presented in Experiments 1 and 2. The frequencies of the majority of pure-tone sounds in each block (grey) were drawn from a contextual distribution that could be narrow (left, blue shading) or broad (right, red shading). The distribution densities are shown on the right in blue and red shading; both were centred at 500 Hz and had s.d. of 0.5 and 1.5 octaves, respectively. Embedded in both sequences were probe tones whose frequencies were either equal to the distribution centres (means, cyan and magenta), or 2 octaves above (odds, blue and red). (b–d) Brain responses evoked by mean and oddball sounds in the context of the narrow and the broad distributions, recorded in a fronto-central channel (FCz) while participants performed a detection task (Experiment 1, b) and a working memory task (Experiment 2) with low (c) and (d) high cognitive load.
