
Figure 2.
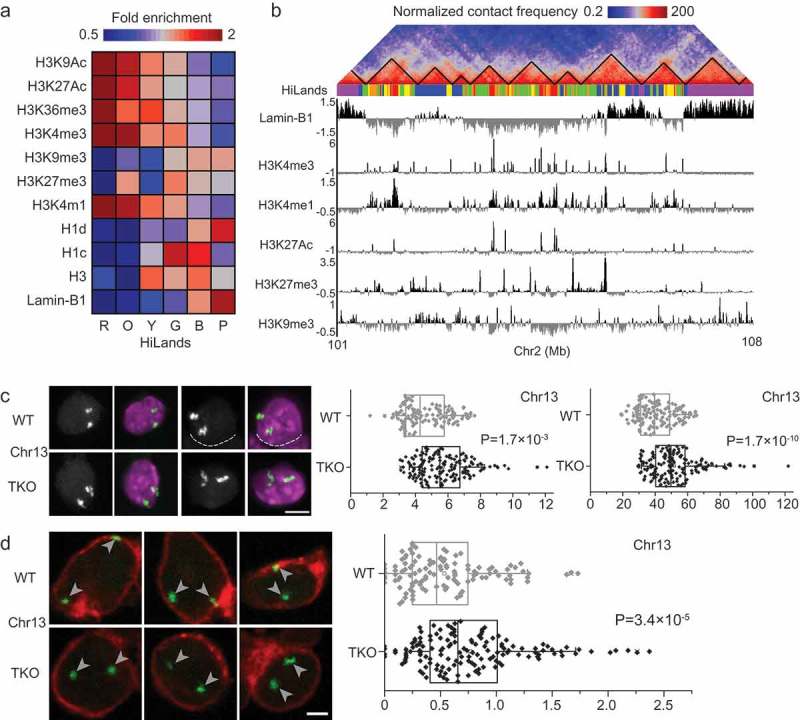
Differential changes in distinct LADs upon lamin loss. (a) Combinatory patterns of different histone modifications, histone H1 and H3, and lamin-B1 DamID reads defining the six different HiLands in mESCs. Heatmap represents the genome-wide fold enrichment of each chromatin state in mESCs. (b) A co-alignment of Hi-C heatmap, color-coded HiLands, lamin-B1 DamID and different histone modifications in a selected region of chromosome 2. Black lines in the Hi-C heatmap delineate TADs. (c) Two representative 3D-FISH images for a selected HiLands-P LAD region (left). Fluorescence images represents DAPI staining for DNA (purple) and FISH signal (white). The white dashed lines delineate the boundaries of neighboring nuclei. Scale bar, 5 μm. Quantifications of the volumes and surface areas of the HiLands-P LAD region (right); p values, Wilcoxon rank-sum test. (d) Three representative 3D-FISH images for a selected HiLands-B LAD region. Immunofluorescence staining of emerin (red) demarcates the boundaries of nuclei and the white arrow heads indicate FISH signals (green). Scale bar, 2 μm. Quantifications of the distances of FISH signals for the HiLands-B LAD region to the nuclear envelope marked by emerin (right); p values, Wilcoxon rank-sum test. Figures are from Zheng et al. 2018, courtesy of the authors.