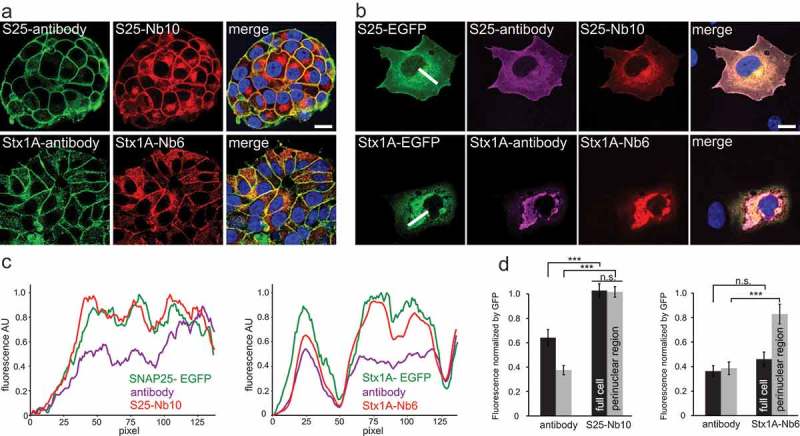
Figure 4.

Both nanobodies reveled epitopes that are not reported by antibodies in highly crowded regions of endogenously-expressing PC12 cells or over-expressing COS-7 cells. (a) PC12 cells were co-stained with conventional monoclonal antibodies and with our fluorescently labeled nanobodies. Monoclonal anti SNAP-25 and Syntaxin 1A (clone 71.1 and HPC-1) were detected with a secondary antibody conjugated to Abberior-Star580 (in green). S25-Nb10 or Stx1A-Nb6 were conjugated to a single Atto647N fluorophore (in red). Laser scanning confocal images of the nanobody and the antibody signals colocalize relatively good at the plasma membrane, but the nanobodies also reveal stronger signals in the perinuclear areas (especially evident for SNAP-25). The scale bar represents 10 µm. (b) Laser scanning confocal images of COS-7 cells transiently transfected with SNAP-25 or Syntaxin 1A fused to EGFP (in green) and co-stained with monoclonal primary and Cy3-fluorescently labeled secondary antibody (clone 71.1 and clone 78.2, in magenta) and nanobodies directly conjugated to Atto647N (in red). Scale bar represents 10 µm. (c) Line profiles of the white lines displayed in (B) are shown for all three channels, each channel was normalized to its maximum signal intensity on the picture. (d) The average fluorescence of full cells, black bars or at the perinuclear regions, light-grey bars in respect to their EGFP signals were calculated. For every selected region of interest, the averaged fluorescence signal of antibodies or nanobodies was calculated and normalized to the average EGFP-fluorescence in the respective region. Statistical analysis was done using unpaired t-test, error bars represent SEM, from three independent experiments analyzing a total of 37 cells for SNAP-25-EGFP and 36 cells for Stx1A-EGFP. n.s. = not significant.
