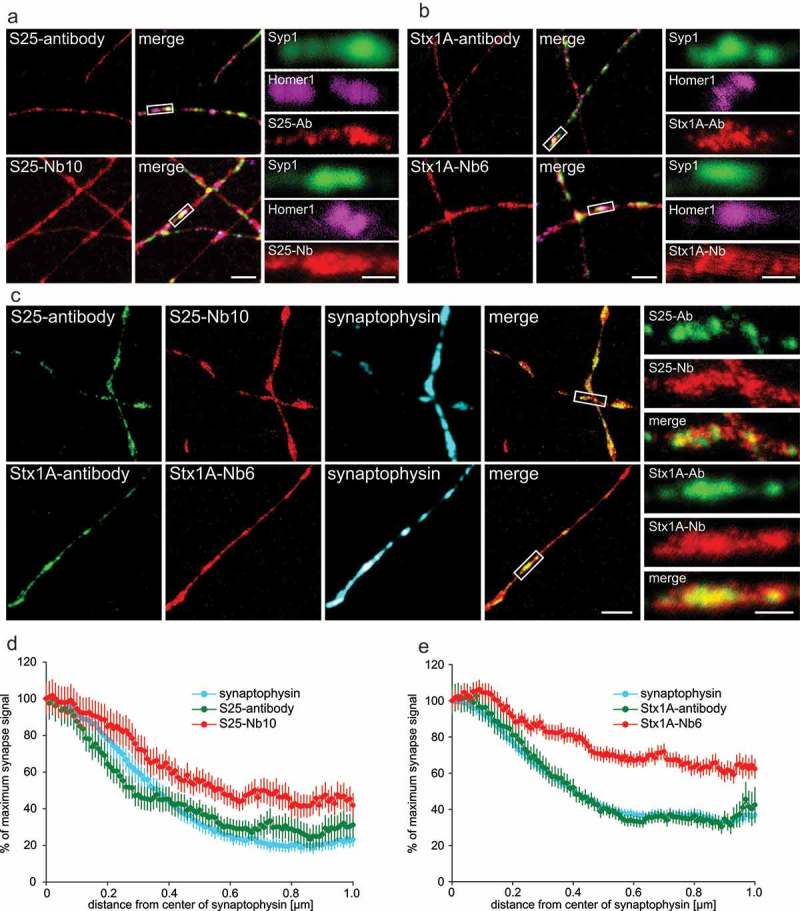
Figure 5.

STED microscopy shows that nanobodies detect an extra-synaptic population of SNAP-25 and Syntaxin 1A in primary hippocampal neurons. (a & b) Cultured neurons (14–16 days in vitro) were co-stained with SNAP-25 or Syntaxin 1A monoclonal antibodies (clone 71.1 or 78.2, respectively) or with the nanobodies bearing Atto647N fluorophores (in red) and with the pre-synaptic marker antibodies against Synaptophysin 1 (Syp1) and the post-synaptic marker Homer1. The merge panels display the synaptic markers and the other co-stained protein in red. Zoomed region of synapses suggest that antibodies and nanobodies are enriched at synapses, but the signals from the nanobodies are also present in extra-synaptic areas. The scale bars represent 2 µm and 500 nm in the low and high zoom, respectively. (c) For two-color STED microscopy, primary neurons were co-stained using the same monoclonal antibodies as in (a), detected using a secondary antibody conjugated to Abberior-Star580 and with the nanobodies coupled to Atto647N. Synapses were located in confocal mode with Synaptophysin antibodies as in (a). The merge panel only includes the two STED channels for simplicity. The zoomed areas show each channel and the overlap of both antibody and nanobody STED signals. The scale bars represent 2 µm and 500 nm in the low and high zoom, respectively. (d & e) Analysis of the signal distribution up to 1 µm from the center of a synapse (determined by the center of mass of the Synaptophysin staining). We analyzed 176 synapse line scans from six independent experiments for SNAP-25 and 632 synapse line scans from six independent experiments for Syntaxin 1A. The nanobody signals are significantly higher than the antibody signals outside synapses for both experiments (Wilcoxon rank sum tests; p = 0.0016 for SNAP-25; p < 0.00001 for Syntaxin 1A).
