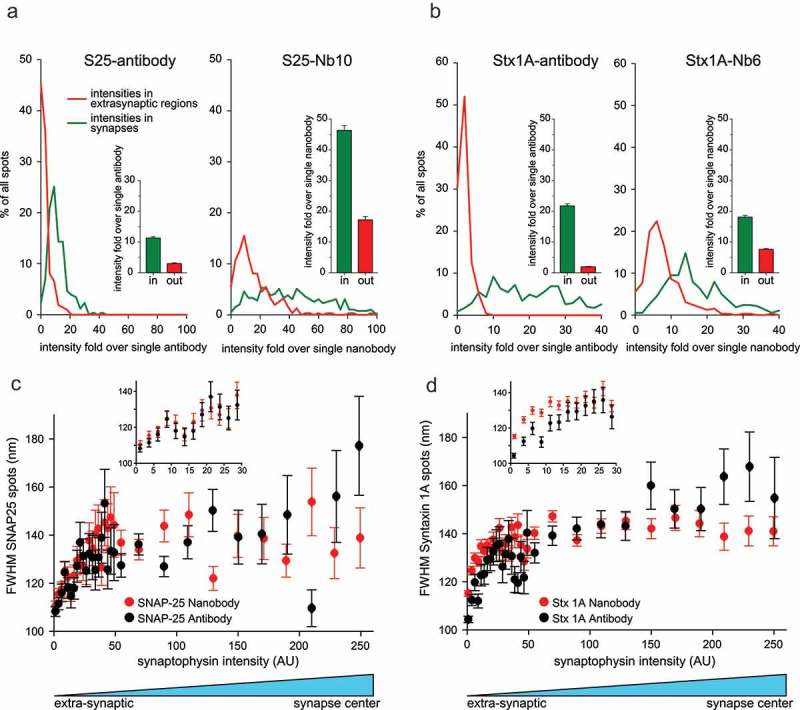
Figure 7.

An analysis of the size and intensity of SNAP-25 and Syntaxin 1A clusters (spots) in hippocampal neurons. (a) The intensity of SNAP-25 spots is shown as intensity fold over single nanobody or antibody. The intensities were obtained by drawing line scans across 259 SNAP-25 clusters in synapses and 212 clusters outside of synapses for the antibody staining. For the nanobody staining, we analyzed 392 line-scans in synapses and 309 line-scans outside of synapses. Both within and outside of synapses, the antibody shows spots of a smaller intensity than the nanobody. The nanobody spots in synapses (green line in right panel) also show a large variability within the signal intensity. Bar graphs (insets) represent the mean of the intensity distributions with their associated SEM. (b) Same analysis as in (a) for Syntaxin 1A. We analyzed 348 line-scans in synapses and 227 outside synapses for antibodies. 378 line-scans were analyzed in synapses and 326 outside synapses for nanobodies. Interestingly, the nanobody spots in synapses (green line in right panel) show a far more limited variability than for SNAP-25 (note the difference in units for the X-axis of SNAP-25 and Syntaxin 1A analyses). (c-d) Analysis of spot size for SNAP-25 or Syntaxin 1A revealed by nanobody (red) or antibody (black), relative to the Synaptophysin intensity (very low signal is extra-synaptic, highest signal is the center of the synapse). The insets present the extra-synaptic areas at higher zoom in the regions of low Synaptophysin intensity. No obvious difference can be observed for SNAP-25 (c), but the Syntaxin 1A spots (clusters) are larger for the nanobody in extra-synaptic areas (p = 0.000082, paired t-test). The analysis was performed on the following number of automatically identified spots: 10,839 spots from seven independent experiments for SNAP-25 nanobodies; 8,546 spots from seven independent experiments for SNAP-25 antibodies; 35,609 spots from 20 independent experiments for Syntaxin 1A nanobodies; 12,468 spots from seven independent experiments for Syntaxin 1A antibodies. The graphs show bi-directional scatter plots, plus SEM, after binning the spots according to Synaptophysin intensity. Note that for the Synaptophysin staining the error bars in the horizontal direction are smaller than the symbol sizes.
