
Figure 1.
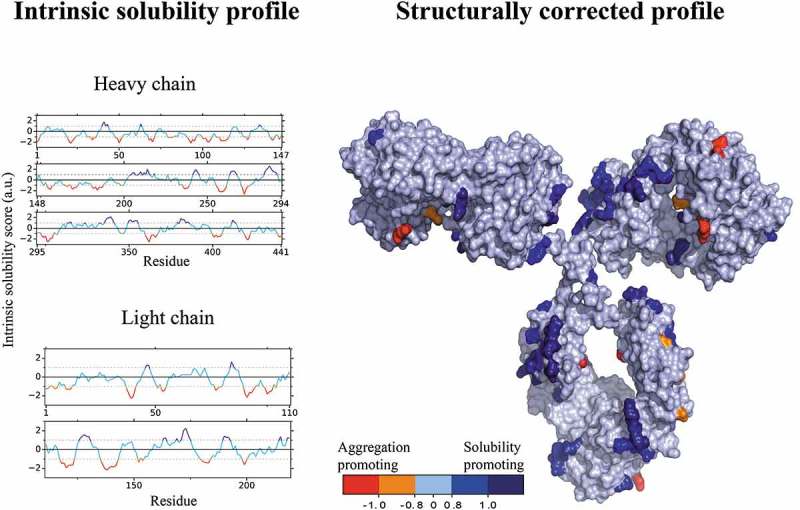
Illustration of the CamSol method applied to HzATNP. The sequence-based intrinsic solubility scores were calculated through a linear combination of physicochemical properties with CamSol (left) and structurally corrected with a 2 Å homology model (right) using a default patch radius of 10 Å. The structurally corrected solubility profile was then projected and color coded on the surface of the antibody. Dark blue represents highly soluble regions, whereas orange and red represent poorly soluble regions.