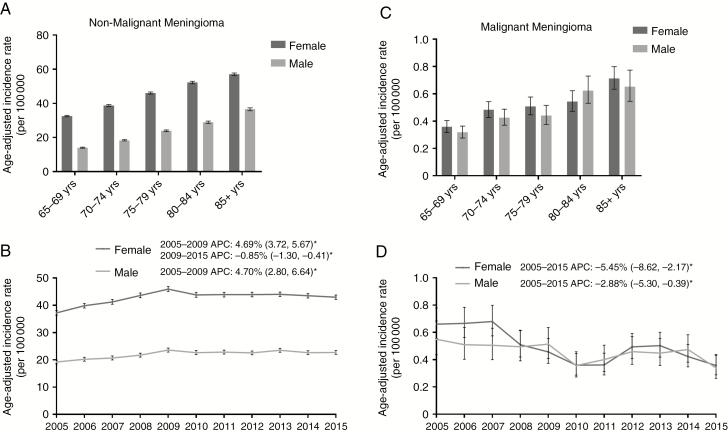
Fig. 1.
(A–D) Age-adjusted incidence rates and annual percent changes (APCs) for nonmalignant meningioma by (A) sex by 5-year age groupings, and by (B) sex over time from 2005–2015. Age-adjusted incidence rates and APCs for malignant meningioma by (C) sex by 5-year age groupings and (D) sex over time in 2005–2015. APCs are accompanied by 95% CIs in parentheses. *Only significant changes in APC are reported in the figures. (CBTRUS 2005–2015)

