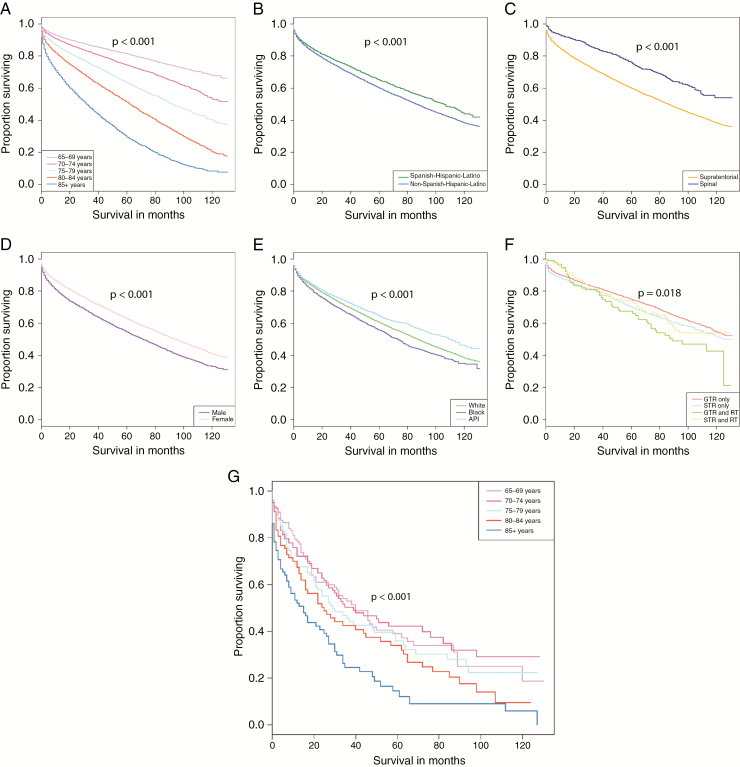
Fig. 4.
Kaplan–Meier curves depicting variables with significant differences in survival for nonmalignant (A–F) and malignant meningioma (G). Significant associations with survival for nonmalignant meningioma included (A) 5-year age groups (P < 0.001), (B) ethnicity (P < 0.001), (C) location (P < 0.001), (D) sex (P < 0.001), (E) race (P < 0.001), and (F) surgical resection/radiation treatment (P = 0.018). The only significant association with survival for malignant meningioma was (G) 5-year age groups (P < 0.001).

