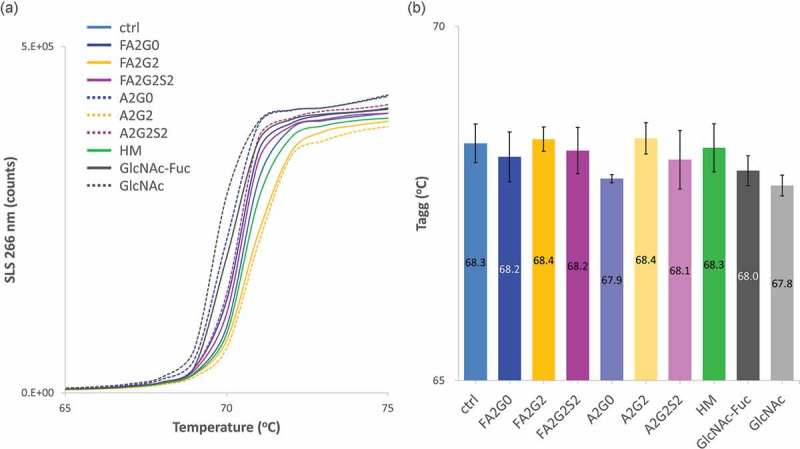
Figure 12.

Static light scattering analysis to measure aggregation propensity by temperature ramping showed aggregation temperature was increased by terminal galactosylation and decreased by terminal sialylation. (a) SLS counts of each glycoform. (b) Aggregation temperatures (Tagg) showed increased stability by terminal galactosylation and decreased stability by terminal sialylation. Core defucosylation also showed slightly decreased Tagg. Error bars represent variation range of n = 2.
