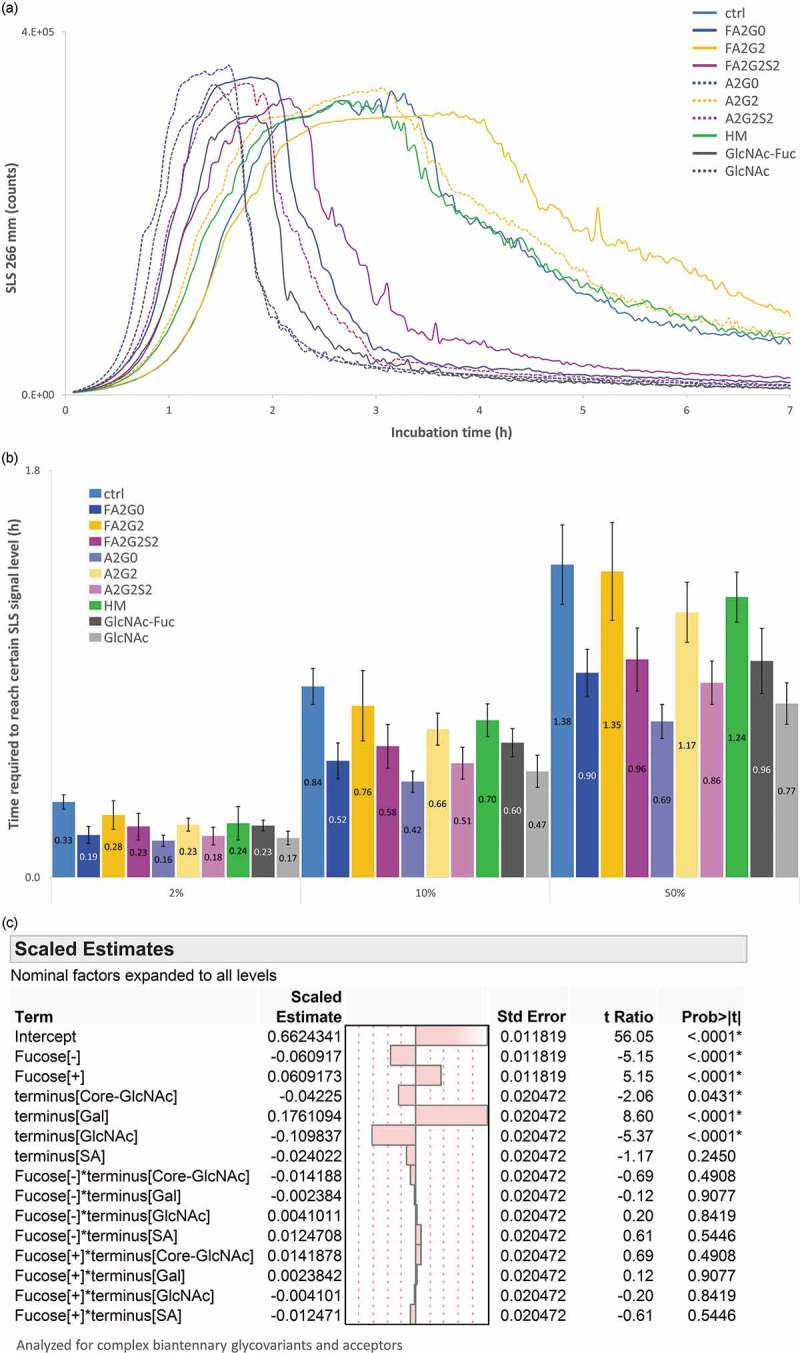
Figure 13.

Static light scattering analysis to measure aggregation propensity by isothermal incubation at 65 °C showed aggregation speed was decreased by terminal galactosylation and increased by core defucosylation and terminal sialylation. (a) SLS counts for seven hours. (b) Time required to reach 2, 10 and 50% of maximum SLS counts for each glycoform. Error bars represent SD of n = 3. (c) JMP analysis: Scaled estimates of effect of glycosylation for relative time required to reach certain levels. Time required to reach 2, 10 and 50% of maximum SLS counts was converted into relative time to average of mAb-ctrl and statistically analyzed for complex biantennary glycoforms and acceptors.
