Abstract
Objective
The objective of this study was to investigate the morphologic features and 68Ga-prostate-specific membrane antigen (PSMA)-11 avidity of celiac ganglia (CG) on multimodal PET/MRI.
Materials and methods
68Ga-PSMA-11 whole-body PET/MR examinations in 120 patients, referred for staging or follow-up of prostate cancer, were retrospectively reviewed to investigate the radiotracer uptake [maximum standardized uptake value (SUVmax)] and morphologic features (size, shape, location) of CG. Nodular, oval and longitudinal nodular, thick or with oval parts shapes of CG were regarded as mistakable with lymph nodes, whereas linear and longitudinal shapes were considered as not mistakable.
Results
On MR scans, CG were visible in 98% (117/120) on both sides and in two patients only on the left side. Mistakable CG shape was detected in 69% (83/120) of patients on both or at least one side. The left CG were thicker (4±1.4 mm; range: 1.5–7.5 mm) than the right ones (3±1.3 mm; range: 0.5–7 mm). Mean SUVmax was 2.51±1.17 (range: 0.02–5.48) in the left CG and 2.23±1.22 (range: 0.02–5.91) in the right CG. Increased 68Ga-PSMA-11 uptake, SUVmax at least 2, was detected in 75% (90/120), and both – erroneous shape and elevated 68Ga-PSMA-ligand uptake – was observed in 55% (66/120) of all patients on both sides or at least one side.
Conclusion
Frequently observed, the nodular, oval and longitudinal (nodular, thick or with oval parts) shape of CG, especially of the thicker left CG, on MR scans may cause mistaking them for lymph nodes, even abnormal or metastatic. On whole-body PET/MRI, evident and sometimes high 68Ga-PSMA-11 uptake in CG increases the risk of a misinterpretation of them as metastases.
Keywords: celiac ganglia, 68Ga-PSMA, lymph node, metastasis, PET/MR, prostate
Introduction
Celiac ganglia (CG) are intrinsic parts of the complicated neural sympathetic network, symmetrically organized around blood vessels and organs in the upper abdomen (Fig. 1). CG are the biggest consolidated parts of this network 1. Although generally clearly visible on modern computer tomography (CT) and especially on MRI, CG seem not to be sufficiently identified by the radiologists. Only the anesthesiologists were since long interested in precise localization and visualization of CG with different subsequently developing methods of imaging, for the procedures of CG therapeutic blockade 2–4.
Fig. 1.
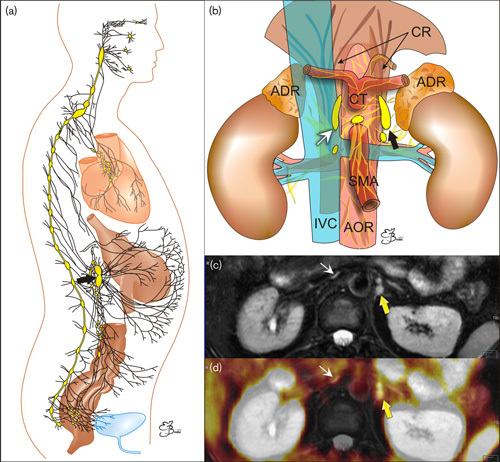
(a) Schematic presentation of the sympathetic system network (black lines) with compact parts called ganglia (oval objects). (b) Schematic presentation of the coeliac ganglia (arrows) location. ADR, adrenal glands; AOR, aorta; CR, crura of the diaphragm; CT, coeliac trunk; IVC, inferior vena cava; SMA, superior mesenteric artery. (c, d) transverse images on the level of celiac ganglia (arrows): (c) MR T2-weighted fat-saturated image. (d) Multimodal 68Ga-PSMA-11 PET/MRI. PSMA, prostate-specific membrane antigen.
The shape of CG has been described as lobulated, nodule shaped, oval, bean shaped, band shaped, teardrop, comma, retort, discoid, lamina shaped, sickle shaped or half-moon, in different anatomical or imaging studies so far 1,5–10. Because of their nonspecific shape, there is a strong possibility of mistaking the CG for other structures, including pathological.
Especially the left celiac ganglia (L-CG), if oval or lobulated in shape, with a mean short-axis diameter of 4 mm 9,11 and range up to 9 mm reported in cadaver studies (5), may be radiologically mistaken for a metastatic lymph node or other kind of retroperitoneal malignancy, including those of adrenal origin 1,5,10,12. Even fine-needle aspiration biopsy results may be misleading, if the cytologist is not aware of the possibility of targeting a CG, because its morphologic differential diagnosis includes also reactive lesions and even neoplasms (e.g. melanoma, neurogenic tumors, seminoma, Hodgkin lymphoma) 13.
However, before the introduction of 68Ga-prostate-specific membrane antigen (PSMA)-targeted radiotracers in multimodal PET imaging, the awareness of CG existence was less crucial.
Upon the introduction of 68Ga-PSMA ligands to the PET/CT and PET/MRI in the detection, management and treatment of prostate cancer, a substantially high radiotracer uptake in normal CG was recognized as one of the pitfalls 8,11,14–16. Thus, the potential morphological trap on the CT or MR part of the multimodal imaging has been significantly enhanced by the functional molecular deception on PET scans.
The knowledge of the location, morphology and uptake of PSMA ligands in CG becomes, therefore, even more important now, in view of the widespread imaging of this type and its excellent results in early detection and treatment monitoring of prostate cancer, with significantly better sensitivity than previously used radiotracers 17. When a diagnostic imaging specialist describing multimodal PET will see the uptake in a CG and describe it wrongly as a single mestastasis, that may lead to wrong therapeutic decisions (treating a healthy patient). In addition, there are appearing reports of detection also other than prostate cancer malignancies and their metastases with application of PSMA ligands 18. If in the future PSMA PET/CT and PSMA PET/MRI will be used for other oncological purposes, CG may be wrongly taken for abdominal paraaortic metastases in other cancers as well. Therefore, in the view of possible increase in the number of PSMA multimodal PET studies, there is also growing importance of being familiar with “celiac pitfall”. Although there are a few studies concerning the mistakable appearance of CG on PET with 68Ga-PSMA-ligand, even the recent one by Rischpler et al. 8, they all concern PET imaging combined with CT 11,14–16.
In this study, the authors conducted a detailed analysis of MR morphological features and localization of CG, as well as characteristics of their PSMA-ligand uptake on multimodal PET/MRI, with special attention to circumstances increasing the possibility of potential serious diagnostic pitfalls (Fig. 1).
Materials and methods
One hundred and twenty whole-body 68Ga-PSMA-11 PET/MR studies undertaken in 120 randomly chosen patients examined between January 2016 and February 2018 constituted the subject of detailed retrospective analysis. The retrospective study was performed in accordance with the principles of the 1964 Declaration of Helsinki and all subsequent revisions and with national regulations. All patients had provided routine written informed consent before each examination.
The patients were male individuals (age range: 40–83 years, mean 64±6.85 years; weight range: 59–123 kg, mean: 86±11 kg) referred for routine primary staging or follow-up of prostate cancer. Twenty-six patients were referred for exclusion or primary staging of a prostate cancer without any previous treatment (three were healthy, two demanded further diagnostics and control, 21 had a newly diagnosed prostate cancer), and 95 patients were treated (underwent radical prostatectomy or other treatment: transurethral resection, high-intensity focused ultrasound, irreversible electroporation, sectioning with nanoknife, brachytherapy, teleradiotherapy, hormone therapy, and combinations of the above or other treatment). All examinations were performed using a multimodal PET/MR system (Biograph mMR scanner; Siemens, München, Germany; based on the 3T MR platform). All patients underwent the whole-body MR and the whole-body PET imaging for about 81±22 min (range: 50–157 min) after injection of 169±20 MBq (range: 115–225 MBq) of 68Ga-PSMA-11.
68Ga-PSMA-11 was synthesized as follows. 68Ge/68Ga generator (Eckert & Ziegler Rdiopharma GmbH, Berlin, Germany) was eluted with 5 ml of sterile, ultra-pure 0.1 mol/l hydrochloric acid, in order to obtain a sterile, endotoxin-free solution of 68Ga chloride. For labelling, a vial containing 20 µg sterile and endotoxin-free lyophilisate of PSMA-11 (GMP) (ABX, Radeberg, Germany) and a vial containing 60 mg of sodium acetate were used. To the above set, 2 ml of 68Ga chloride was added and mixed for 10–20 s to complete dissolution. Subsequently, the mixture was incubated for 10 min at 95°C. The labelled tracer was purified on a column of Sep-Pak Light C18 (Waters Corporation, Milford, Massachusetts, USA) and filtered on a 0.22 μm pore size filter (MILLEX-GV; Merck Tullagreen, Carrigtwohill, County Cork, Ireland). Radiochemical purity (≥95%) was confirmed by thin-layer chromatography, which was checked on iTLC-SG bands in ammonium acetate-methanol (1 : 1) solution.
To reduce patients’ discomfort during the long PET/MR examination time, the patient’s arms were placed alongside the body. PET and MRI were performed simultaneously. MR sequences included axial T2-weighted TSE fat-saturated 5 mm-slice, 400 mm field-of-view (FOV) images, respiratory gated in the region of the chest and abdomen, axial T1-weighted Vibe Dixon 3 mm-slice, 430 mm FOV images, breath-holded in the region of the chest and abdomen and diffusion 6 mm-slice, 380 mm FOV images with free-breathing (b=0, and 800 s/mm2). Attenuation correction was calculated according to the manufacturer’s protocol on the basis of a fast 3D FLASH-based MR VIBE (volume interpolated breath-hold examination) sequence. As the tissue class segmentation for whole-body MR-based attenuation correction includes air, lung, fat and soft tissue, a dual contrast two-point Dixon acquisition protocol was used with an in-phase and an opposed-phase echo. These segmentations into four classes have been shown to provide comparable PET image results in comparison with standard CT-based reconstructions. Dixon is a common technique to allow for inline MR fat and water segmentation. Hence, a single acquisition results in a total of four image series and contrasts (in phase, opposed phase, fat and water contrast), which are used to compute the attenuation maps.
PET imaging was performed with an acquisition time of 5 min per bed position in a caudocranial direction starting from the pelvis. Acquired PET sinograms were reconstructed with the HD-PET algorithm (point-spread function) using three iterations, 21 subsets, and a Gaussian filter: the full width at half maximum 4.0 mm, an image matrix of 172. Performed separately, pelvis and lower limbs PET/MRI was not analyzed in the current study.
Image analysis
The retrospective review included the features of coeliac sympathetic ganglia on 68Ga-PSMA-11 PET/MR scans, the radiotracer uptake [maximum standardized uptake value (SUVmax) normalized by body weight] and morphologic features (the size, shape and location) on MRIs. The background 68Ga-PSMA-11 activity was measured in gluteal muscles (GM) and the descending aorta (DA). SUVmax in the liver and kidneys was also recorded. Analysis and quantification were performed on a Syngo.via Viewer workstation (Siemens). Examinations were analyzed by two experienced certified diagnostic imaging specialists qualified in radiology and nuclear medicine, on a side-by-side basis to reach a consensus.
CG shapes that can be mistaken for lymph nodes, both normal and metastatic (malignant), included nodular (nodules variable in number, sometimes multiple; pure nodules and also nodular-longitudinal or nodular-linear), oval and longitudinal nodular, longitudinal thick or longitudinal with oval parts (Fig. 2a). Not-mistakable CG shapes included linear-regular, linear-irregular or wavy, linear-intermittent, and linear with small nodules and longitudinal (Fig. 2b).
Fig. 2.
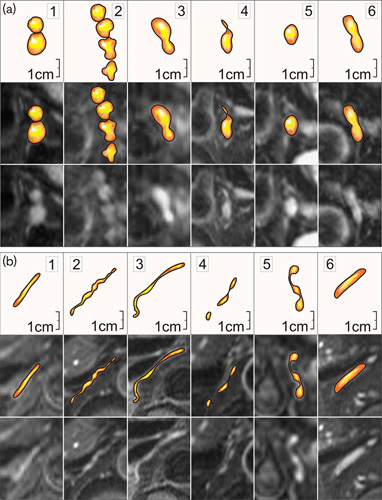
Examples of coeliac ganglia shapes similar to lymph nodes and easily mistaken for them (a) and not possible to be mistaken with lymph nodes (b). Lower images: transverse MR T2-weighted fat-saturated scans. (a): 1 and 2 – nodular; 3 – nodular-longitudinal; 4 – nodular-linear; 5 – oval; 6 – longitudinal-nodular. (b): 1 – linear-regular; 2– linear-irregular; 3 –linear-wavy; 4 – linear-intermittent; 5 – linear with small nodules; 6 – longitudinal.
Statistical analysis
Statistical calculations were performed using Stata software package version 14.1 (Stata Statistical Software: Release 14; StataCorp., College Station, Texas, USA). Normality assumption was verified using the Shapiro–Wilk test. A significant test result was interpreted as violation of normality (when the P≤0.05). The assessed variables included the patients’ age (years), height (cm), weight (kg), radiotracer dose (MBq), uptake time (min), background in the GM (SUVmax), DA (SUVmax), and liver (SUVmax), radiotracer uptake in the right celiac ganglia (R-CG) and L-CG (SUVmax), dimensions (thickness, width, length) of the R-CG and L-CG (mm), and activity in the kidneys (SUVmax). Linear association between parameters was examined using the Spearman rank coefficient of correlation. Spearman rank coefficient was examined between the following (and they are): (a) age and uptake in the R-CG and L-CG, background in GM, DA and in liver; uptake time and uptake in the R-CG and L-CG, background in GM, DA and in liver; (b) uptake in the R-CG and its thickness, background in GM, DA and in liver; and (c) uptake in the L-CG and its thickness, background in GM, DA and in liver. A significant test result was interpreted as evidence of a nonrandom association between parameters. The level of linear association, in case of a significant result, was interpreted using the rule of thumb for interpreting the size of a correlation coefficient (Table 1) 19.
Table 1.
The rule of thumb for interpreting the size of a correlation coefficient 19

Results
On MR scans, CG were visible in 117 patients out of 120 (98%) on both sides and in two patients only on the left (L) side. In one patient, a reliable identification of both CG, and in two other patients, the identification of the R-CG was not possible either on MR or PET scans, probably due to their extreme thinness. One L-CG was excluded from the statistics, apart from the location.
Dimensions of CG are displayed in Table 2. A moderate positive correlation was detected between the thickness of the R-CG and the L-CG (rs=0.51, P<0.0001).
Table 2.
Dimensions of celiac ganglia
The vast majority of the L-CG revealed shapes that could be mistaken for lymph nodes. Detailed assignment of mistakable and not-mistakable CG shapes is presented in Tables 3 and 4, and, in respect to the total number of patients, in Fig. 3.
Table 3.
Detailed list of right celiac ganglion shapes on MRI with their classification as mistakable with lymph nodes or not
Table 4.
Detailed list of left celiac ganglion shapes on MRI with their classification as mistakable with lymph nodes or not
Fig. 3.
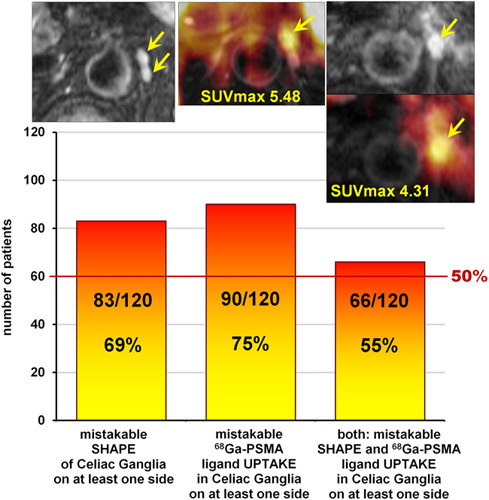
Number of patients who presented mistakable celiac ganglion (CG) features with respect to their shape on MR, 68Ga-prostate-specific membrane antigen (PSMA)-ligand uptake on PET, or both features on at least one side. In the upper row from the left transverse images: MR T2-weighted fat-saturated image, fused MR-PET image, MR T2-weighted fat-saturated image, below fused MR-PET, all presenting mistakable CG (arrows) in three different patients.
Described previously on CT as typical for CG comma, comma-like, tear or crescent shape was very rarely observed on MR, only in 3% (3/117) on the right side and 13.5% (16/118) on the left side (Table 5 and Fig. 4).
Table 5.
Frequency on MRI of typically described on computer tomography comma, comma-like, tear or crescent celiac ganglion shapes
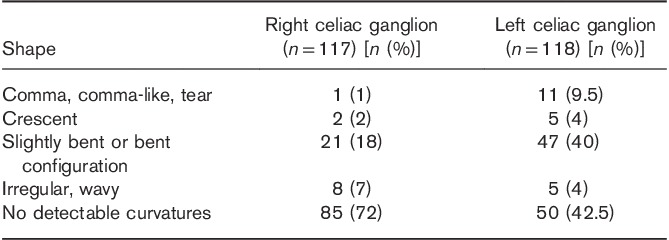
Fig. 4.
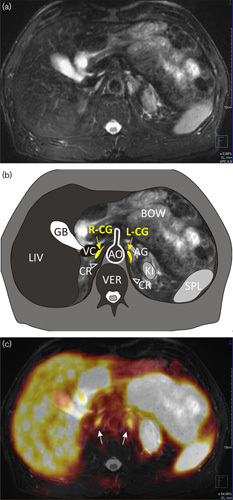
Comma-shaped left celiac ganglion (L-CG). (a) MR T2-weighted fat-saturated transverse image. (b) Scheme: AG, adrenal gland; AO, aorta; BOW, bowel; CR (and arrowheads), crura of the diaphragm; GB, gallbladder; KI, kidney; LIV, liver; R-CG, right celiac ganglion; SPL, spleen; VC, inferior vena cava; VER, vertebra. (c) Multimodal 68Ga-PSMA-11 PET/MRI with increased uptake in both CG (arrows). SUVmax in R-CG=3.72, in L-CG=3.85. PSMA, prostate-specific membrane antigen; SUVmax, maximum standardized uptake value.
Mean SUVmax was 2.51±1.17 (range: 0.02–5.48) in the L-CG and 2.23±1.22 (range: 0.02–5.91) in the R-CG. A low positive correlation was detected between CG SUVmax and their thickness (rs=0.35; R-CG: P=0.0001, L-CG: P=0.0003). Negligible positive correlation was detected between CG SUVmax and liver SUVmax (R-CG: rs=0.29, P=0.002; L-CG: rs=0.22, P=0.016) and between R-CG SUVmax and the background in the DA (rs=0.25, P=0.006). Negligible negative correlation was detected between CG SUVmax and kidney SUVmax (R-CG: rs=−0.30, P=0.046; L-CG: rs=−0.26, P=0.014).
The mean SUVmax of the background measured in GM and in the DA was 1.05±0.33 (range: 0.46–2.00; median: 0.99) and 1.07±0.55 (range: 0.13–2.91; median: 0.89), respectively. There was a low positive correlation between them (rs=0.48, P<0.0001). A negligible positive correlation was detected between age and SUVmax in GM (rs=0.28, P=0.002), and a negative one between uptake time and the SUVmax in the DA (rs=−0.25, P=0.006).
As increased, mistakable with lymph node metastases, 68Ga-PSMA-11 uptake in CG we regarded SUVmax ≥2 (of at least 2). There are a few reasons for the choice of that value. First, because SUVmax of 2 was a previously proposed cut-off value for prostate cancer metastases 23–25. It was also the upper limit of the background activity in GM in our study. Moreover, the range of SUVmax values detected in prostate cancer lymph nodes metastases, though usually distinctly high, is being reported to begin from 2.0-2,1 [11,26] and therefore SUVmax of 2 be regarded as potentially patholohical.
Both erroneous shape and elevated 68Ga-PSMA-ligand uptake was observed in 55% (65/118) of the L-CG and 14% (16/117) of the R-CG.
Mistakable CG features with respect to the total number of patients are presented in Fig. 3. As the exact knowledge of the location of CG seems crucial for avoiding a diagnostic mistake, the detailed relationship of the CG to the surrounding structures (aorta and its branches, crura of the diaphragm, inferior vena cava, adrenal glands, vertebral column) is presented in Figs 5–8.
Fig. 5.
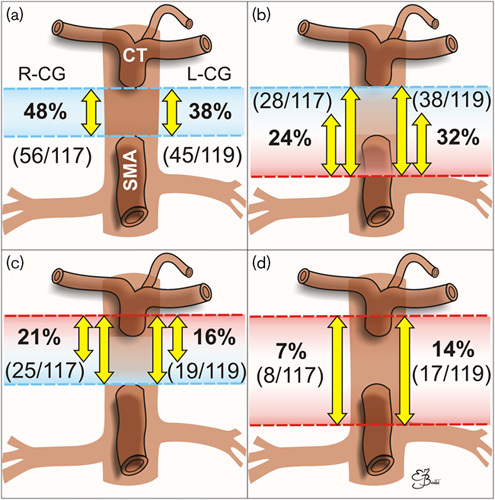
Spatial relationships between celiac ganglia (CG) (R, right; L, left), coeliac trunk (CT) and superior mesenteric artery (SMA) with numbers of patients (in brackets) and percentages. The majority of CG lay between CT and SMA (a), quite often protruding below the origin of the SMA and sometimes reaching the level of the left renal vein (b). Only a small number of CG were protruding (markedly or slightly) above the level of CT (c), sometimes extending also below SMA (distinctly of slightly) (d).
Fig. 8.
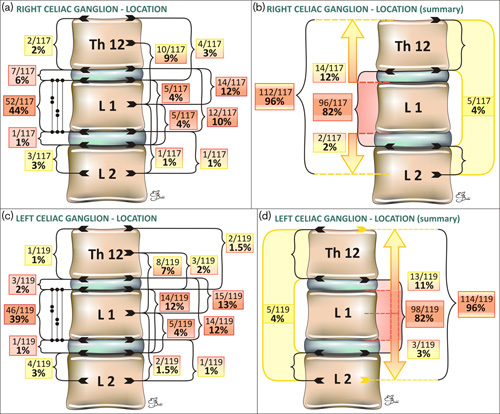
Schematic presentation of the right (a, b) and left (c, d) celiac ganglia (CG) location with respect to the vertebral column (with numbers of patients and percentages). Protruding ganglia are marked with arrows. Detailed analysis (a, c) and summary (b, d).
Fig. 6.
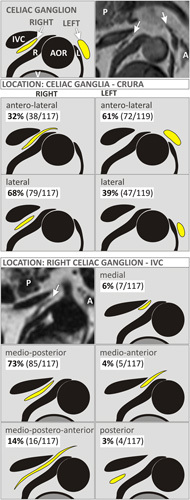
Schematic presentation of the celiac ganglia (CG) (arrows) location with respect to the crura of the diaphragm (R, right; L, left) and inferior vena cava (IVC) with colors like those on T1-weighted Dixon fat-only images. A, adrenal gland; AOR, aorta; P, pancreas; V, vertebral body. Upper right image – exemplary T1-weighted image of the R-CG located laterally to the right crus of the diaphragm and the L-CG located anterolaterally to the left crus of the diaphragm. Left middle MRI – exemplary T1-weighted Dixon fat-only image of the R-CG located medioposteriorly to the IVC.
Fig. 7.
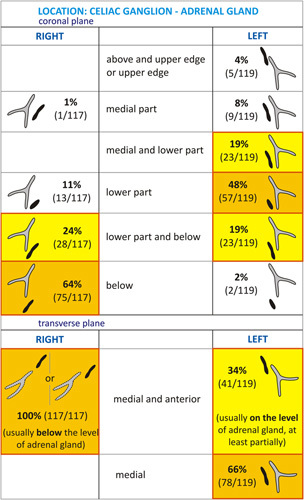
Schematic presentation of celiac ganglia (CG) location with respect to the adrenal glands in the coronal and transverse planes (with numbers of patients and percentages).
Discussion
CG, consolidated parts of the sympathetic neural system, may adopt tumor-like shapes, thus constituting a diagnostic trap, especially on oncologic CT or MRI. Particularly, the bigger L-CG may reach a minimal axis diameter of up to 7 mm, as revealed in our PET/MR study, and according to Abtahi et al. 5 in a CT-based study, even up to 22 mm, but there is a possibility of a different measurement plane. In our study, the short axis of the CG was measured as a perpendicular line to the long CG axis on the transverse plane, but not as parallel to any axis of the body.
However, before the era of PET with PSMA ligands the radiologists’ interest in CG or even the awareness of their presence on CT and MRIs seemed to be really infrequent. They were probably taken for celiac lymph nodes, usually benign, because of their size.
In our study, the mean short axis of the L-CG amounted to 4 mm and the R-CG 3 mm. The same values were obtained by Wang et al. 9 in a CT-based study, which is in concordance even with the anatomical study from the year 1907 1. Similarly, Krohn et al. 11 provided 4 mm as a mean short dimension of all identified CG. However Zhang et al. 10 reported lower values of 2.58 mm for the R-CG and 3.05 mm for the L-CG, but MRI was performed on cadavers, which was the most probable cause of differences. In most previous papers concerning PET avidity of CG, their dimensions were not measured.
Bilateral identification of CG was possible on MRIs in 98% of patients in our study, which is a higher detection rate than that obtained on CT (66%) 9. This is not surprising, due to the obvious better resolution of MR in general, and difficulties of distinguishing tissue boundaries, especially of small lesions, in case of a low amount of visceral fat on CT.
In spite of the fact that the short-axis diameter regarded as the radiological indicator of lymph node enlargement in coeliac area is as much as 10 mm, or 8–10 mm if numerous nodes are present 20, there are also size-independent morphological features that are considered pathological, such as oval (rounded, elliptical) or nodular shape and lack of visible hilum 21. CG may adopt the above-mentioned features. A considerable number of patients in our study (69%) turned out to present morphologically the mistaken shape of CG on at least one side. This is a higher rate than that reported in CT-based studies (65% multilobulated L-CG and 64% R-CG, but with respect to the number of visualized CG, not the total number of patients) 9, and it may be the consequence of differences in the image conspicuity between these two modalities. The above-mentioned differences were probably also the reason for the surprisingly low prevalence of comma-like, tear or crescent CG shapes in our MR-based study, in comparison with previous CT-based ones.
After disclosing of 68Ga-PSMA-ligands uptake in normal CG on PET/CT imaging, which may lead to an erroneous suggestion of prostate cancer metastases 8,11,14–16, the coeliac pitfall became more common and serious. PSMA, nowadays a misleading term for a glutamate carboxypeptidase II (GCPII, EC 3.4.17.21), is a transmembrane proteolytic enzyme physiologically to be found in different parts of the body, also strongly expressed in the nerve cells within CG, thus explaining CG avidity on multimodal PSMA-ligand PET imaging 11.
In our study, mean SUVmax in the L-CG was 2.51, in the R-CG 2.23, and 2.37 with respect to all CG, which is slightly lower than that reported in CT-based multimodal PET studies, wherein mean SUVmax ratios in both CG were 2.9–3.56 8,11,14 or 2.6 in the R-CG and 2.7 in the L-CG 15. The reason for that may be the different methods for attenuation correction used in CT and MRI, as well as the halo artifact from the kidneys, which often suppresses or even eliminates the signal from the neighboring structures, including CG in MRI 22. In our study, higher kidney SUVmax correlated with lower CG SUVmax with statistical significance (P=0.014). Thus, the results of CG uptake from 68Ga-PSMA PET/MR may be slightly underestimated, yet equally notable and of significance, in comparison with PET/CT.
As increased, mistakable with lymph node metastases, 68Ga-PSMA-11 uptake in CG we regarded SUVmax of at least 2, a previously proposed cut-off value for prostate cancer metastases 23–25. SUVmax of two was also the upper limit of the background activity in GM in our study. Moreover, the range of SUVmax values detected in prostate cancer lymph nodes metastases, although usually distinctly high, is being reported to begin from 2.0 to 2.1 11,26.
We found this mistakable uptake in the vast majority of all patients (75%) on at least one side, in 71% of patients in the L-CG, and in over half (54%) of patients in the R-CG.
However, elevated, highly suspicious uptake was sometimes found in a thin, linear, not suspicious morphologically CG. Therefore, we combined both features, mistakable CG shape and mistakable CG PSMA-ligand uptake, obtaining invariably high percentages indicating a possible mistake in 55% of all patients in at least one CG, and in 54% of patients in the L-CG.
Notwithstanding, whether in some cases the reason for high SUVmax in CG may be artefactial shining from adjacent vessels or bowel, the fact is that putting the region of interest on a suspicious morphological ganglion and receiving of such a high uptake strengthens potential mistakes.
The PSMA-ligand uptake adjacent to CG metastases was reported to be significantly higher 8; nevertheless, SUVmax values described in metastatic lymph nodes and CG overlap. The highest SUVmax values recorded in CG were 5.48 in the L-CG and 5.91 in the R-CG in our study, and up to 6.4–6.5 in CT-based studies, with as high values as 7.7 when using the BLOB-OS-TF reconstruction algorithm 11,15,16.
The main hint for the proper identification of CG on imaging, apart from their symmetry and sometimes characteristic shape, remains their location.
General relationships of CG to surrounding structures and organs are compliant with previous anatomical and imaging reports in our study. The ganglia of the coeliac plexus may be flat or elevated, single or multiple, or united by gangliated commissures or flattened nerve strands 1. Proximally, CG are connected with the diaphragmatic ganglion, distally with the renal ganglion, and medially with the opposite one by a horn-like process 1. These anatomical observations explain imaging appearance. Actually, when CG present themselves as a few nodules lying in a raw or scattered irregularly, they may not represent solely CG, but also mesenteric and renal ganglia. However, from a clinical point of view, that seems to be of no significance.
Both CG lie between the renal and mesenteric or diaphragmatic arteries, often at the level of the pancreas; the R-CG is more flattened, and lies between the vena cava (ventral) and right crus of the diaphragm (dorsal), anteromedial to the right adrenal gland; the L-CG is nearer to the median line and lies transversely on the side of the aorta, in front of the left diaphragmatic crus, anteromedial to the left adrenal gland 1,9,10. In our study, the majority of all CG, 72% of the R-CG and 70% of the L-CG, did not exceed the level of origin of the superior mesenteric artery (SMA), which is in disagreement with CG presentation in most anatomical atlases as surrounding SMA or protruding above SMA with their upper poles.
All CG lay between Th12 and the middle part of L2 L in our study, which is generally consistent with previous publications 5,10. The majority of CG (82%) lay between the intervertebral discs Th12–L1 and L1–L2.
What is worth underlining, in our study, is that the majority of the R-CG (64%) lay below the level of the right adrenal gland, caudal to it, and anteriorly and medially to its position (100%), whereas the majority of the L-CG lay at least partially at the level of the left adrenal gland on both planes: coronal plane (94%), and on transverse plane (100%).
The obvious and impossible to avoid limitation of the current study is the lack of histopathological confirmation of the nature of analyzed CG. However, all previous researchers met the same unflounderable boundary. A few of them tried to make a restitution for that by examining cadavers with CT or MRI and later performing the HP analysis, confirming the generally proper identification of CG on imaging 5,10.
To sum up, proper identification and recognition of CG depend strongly on the awareness of the problem, knowledge and personal experience. Paying attention to the ganglia configuration during every-day routine work allows for their better assessment in problematic cases.
Conclusion
Frequently observed, the nodular, oval and longitudinal (longitudinal nodular, longitudinal thick or longitudinal with oval parts) shape of CG, especially of the thicker left CG, on MR scans may cause mistaking them for lymph nodes, and even considered abnormal or metastatic.
On whole-body PET/MRI, evident and sometimes high 68Ga-PSMA-11 uptake in CG increases the risk of a misinterpretation of them as metastases.
Knowledge of the exact location of CG appears crucial for avoiding a diagnostic mistake.
CG on in-vivo PET/MRI are located lower than it has been presented in most anatomy atlases so far, not protruding above the origin of the coeliac trunk. The majority of the R-CG lie below the level of the right adrenal gland, caudal to it, whereas the majority of L-CG lie at least partially at the level of the left adrenal gland.
Awareness of the above facts is the first step to improving diagnostic accuracy by diagnostic imaging specialists and toward proper patient management by clinicians.
Acknowledgements
Conflicts of interest
There are no conflicts of interest.
References
- 1.Robinson B. The abdominal and pelvic brain. Hammond, Indiana: Frank S. Betz; 1907. [Google Scholar]
- 2.Greiner L, Ulatowski L, Prohm P. Sonographically guided and intraoperative alcohol block of the coeliac ganglia in conservatively uncontrollable cancer-induced epigastric pain. Ultraschall Med 1983; 4:57–59. [DOI] [PubMed] [Google Scholar]
- 3.Haaga JR, Kori SH, Eastwood DW, Borkowski GP. Improved technique for CT-guided coeliac ganglia block. AJR Am J Roentgenol 1984; 142:1201–1204. [DOI] [PubMed] [Google Scholar]
- 4.Jacobs JB, Jackson SH, Doppman JL. A radiographic approach to coeliac ganglion block. Radiology 1969; 92:1372–1373. [DOI] [PubMed] [Google Scholar]
- 5.Abtahi SM, Elmi A, Hedgire SS, Ho YC, Pourjabbar S, Singh S, et al. Depiction of coeliac ganglia on positron emission tomography and computed tomography in patients with lung cancer. Clin Imaging 2014; 38:292–295. [DOI] [PubMed] [Google Scholar]
- 6.Gerke H, Silva RG, Jr, Shamoun D, Johnson CJ, Jensen CS. EUS characteristics of coeliac ganglia with cytologic and histologic confirmation. Gastrointest Endosc 2006; 64:35–39. [DOI] [PubMed] [Google Scholar]
- 7.Dal Pozzo G, Bozza A, Fargnoli R, Brizzi E. CT identification of coeliac ganglia. Eur J Radiol 1985; 5:24–26. [PubMed] [Google Scholar]
- 8.Rischpler C, Beck TI, Okamoto S, Schlitter AM, Knorr K, Schwaiger M, et al. 68Ga-PSMA-HBED-CC uptake in cervical, coeliac and sacral ganglia as an important pitfall in prostate cancer PET imaging. J Nucl Med 2018; 59:1406–1411. [DOI] [PubMed] [Google Scholar]
- 9.Wang ZJ, Webb EM, Westphalen AC, Coakley FV, Yeh BM. Multi-detector row computed tomographic appearance of coeliac ganglia. J Comput Assist Tomogr 2010; 34:343–347. [DOI] [PubMed] [Google Scholar]
- 10.Zhang XM, Zhao QH, Zeng NL, Cai CP, Xie XG, Li CJ, et al. The coeliac ganglia: anatomic study using MRI in cadavers. Am J Roentgenol 2006; 186:1520–1523. [DOI] [PubMed] [Google Scholar]
- 11.Krohn T, Verburg FA, Pufe T, Neuhuber W, Vogg A, Heinzel A, et al. [68Ga]PSMA-HBED uptake mimicking lymph node metastasis in coeliac ganglia: an important pitfall in clinical practice. Eur J Nucl Med Mol Imaging 2015; 42:210–214. [DOI] [PubMed] [Google Scholar]
- 12.Collins BT, Warrick J. Endoscopic ultrasound fine needle aspiration biopsy of coeliac ganglia. Acta Cytol 2012; 56:495–500. [DOI] [PubMed] [Google Scholar]
- 13.ElGabry EA, Monaco SE, Pantanowitz L. Frequency and characterization of coeliac ganglia diagnosed on fine-needle aspiration. Cytojournal 2015; 12:4. [DOI] [PMC free article] [PubMed] [Google Scholar]
- 14.Demirci E, Sahin OE, Ocak M, Akovali B, Nematyazar J, Kabasakal L. Normal distribution pattern and physiological variants of 68Ga-PSMA-11 PET/CT imaging. Nucl Med Commun 2016; 37:1169–1179. [DOI] [PubMed] [Google Scholar]
- 15.Kanthan GL, Hsiao E, Vu D, Schembri GP. Uptake in sympathetic ganglia on 68Ga-PSMA-HBED PET/CT: a potential pitfall in scan interpretation. J Med Imaging Radiat Oncol 2017; 61:732–738. [DOI] [PubMed] [Google Scholar]
- 16.Krohn T, Birmes A, Winz OH, Drude NI, Mottaghy FM, Behrendt FF, Verburg FA. The reconstruction algorithm used for [68Ga]PSMA-HBED-CC PET/CT reconstruction significantly influences the number of detected lymph node metastases and coeliac ganglia. Eur J Nucl Med Mol Imaging 2017; 44:662–669. [DOI] [PubMed] [Google Scholar]
- 17.Rauscher I, Düwel C, Haller B, Rischpler C, Heck MM, Gschwend JE, et al. Efficacy, predictive factors, and prediction nomograms for 68Ga-labeled prostate-specific membrane antigen-ligand positron-emission tomography/computed tomography in early biochemical recurrent prostate cancer after radical prostatectomy. Eur Urol 2018; 73:656–661. [DOI] [PubMed] [Google Scholar]
- 18.Nomura N, Pastorino S, Jiang P, Lambert G, Crawford JR, Gymnopoulos M, et al. Prostate specific membrane antigen (PSMA) expression in primary gliomas and breast cancer brain metastases. Cancer Cell Int 2014; 14:26. [DOI] [PMC free article] [PubMed] [Google Scholar]
- 19.Hinkle DE, Wiersma W, Jurs SG. Applied statistics for the behavioral sciences, 5th ed Boston: Houghton Mifflin; 2003. [Google Scholar]
- 20.Einstein DM, Singer AA, Chilcote WA, Desai RK. Abdominal lymphadenopathy: spectrum of CT findings. Radiographics 1991; 11:457–472. [DOI] [PubMed] [Google Scholar]
- 21.Mao Y, Hedgire S, Harisinghani M. Radiologic assessment of lymph nodes in oncologic patients. Curr Radiol Rep 2014; 2:36. [Google Scholar]
- 22.Heußer T, Mann P, Rank CM, Schäfer M, Dimitrakopoulou-Strauss A, Schlemmer HP, et al. Investigation of the halo-artifact in 68Ga-PSMA-11-PET/MRI. PLoS One 2017; 12:e0183329. [DOI] [PMC free article] [PubMed] [Google Scholar]
- 23.Giesel FL, Fiedler H, Stefanova M, Sterzing F, Rius M, Kopka K, et al. PSMA PET/CT with Glu-urea-Lys-(Ahx)-[68Ga(HBED-CC)] versus 3D CT volumetric lymph node assessment in recurrent prostate cancer. Eur J Nucl Med Mol Imaging 2015; 42:1794–1800. [DOI] [PMC free article] [PubMed] [Google Scholar]
- 24.Van Leeuwen PJ, Stricker P, Hruby G, Kneebone A, Ting F, Thompson B, et al. 68Ga-PSMA has a high detection rate of prostate cancer recurrence outside the prostatic fossa in patients being considered for salvage radiation treatment. BJU Int 2016; 117:732–739. [DOI] [PubMed] [Google Scholar]
- 25.Vinsensia M, Chyoke PL, Hadaschik B, Holland-Letz T, Moltz J, Kopka K, et al. 68Ga-PSMA PET/CT and volumetric morphology of PET-positive lymph nodes stratified by tumor differentiation of prostate cancer. J Nucl Med 2017; 58:1949–1955. [DOI] [PMC free article] [PubMed] [Google Scholar]
- 26.Sahlmann CO, Meller B, Bouter C, Ritter CO, Ströbel P, Lotz J, et al. Biphasic 68Ga-PSMA-HBED-CC-PET/CT in patients with recurrent and high-risk prostate carcinoma. Eur J Nucl Med Mol Imaging 2016; 43:898–905. [DOI] [PubMed] [Google Scholar]


